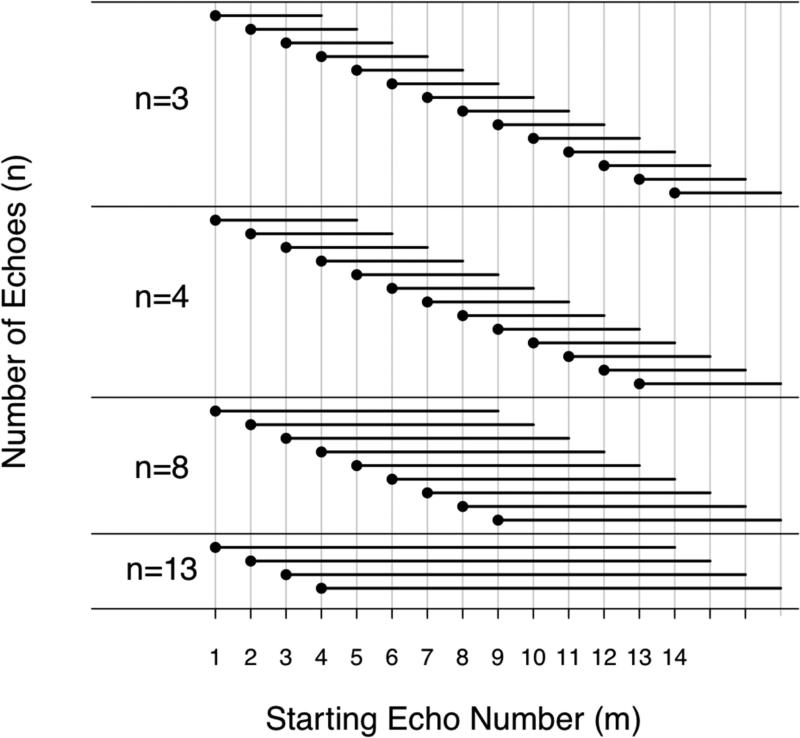
Figure 1.
Illustration of MRI-FF estimation with the number of echoes, n = 3, 4, 8, and 13 echoes. The total number of echoes, n, is represented by the length of the black bars. Each bar starts at the at the starting echo number, m. m of 1 to 14 is possible for n=3; 1 to 13 for n=4, 1 to 9 for n=9; 1 to 3 for n=13: the number of possible starting echo numbers decreases as the total number of echoes increases.

