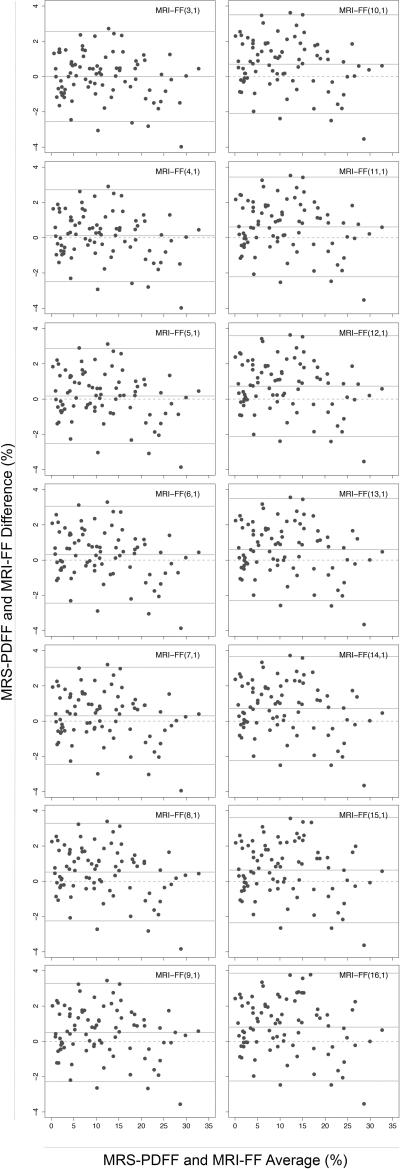
Figure 2.
Bland-Altman plots of MRS-PDFF and MRI-FF(n,1) for all n from 3 to 16. Each plot shows the limits of agreement: average difference +/- 1.96 standard deviation of the differences. The average difference summarizes the size and overall direction of the raw differences between MRS-PDFF and MRI-FF.

