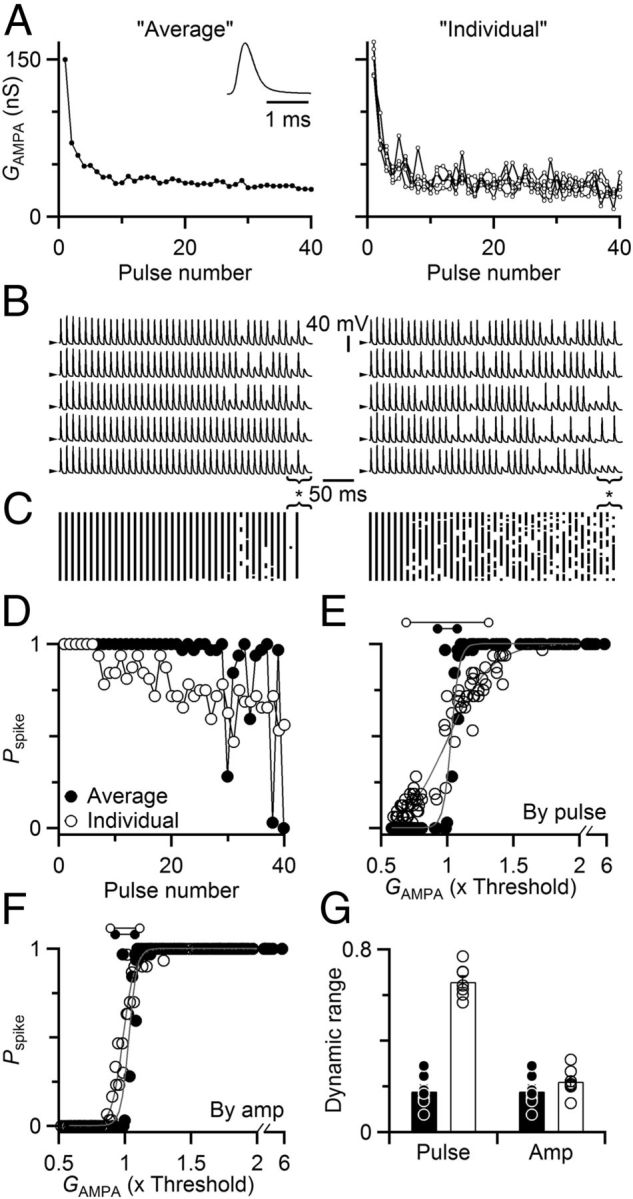
Figure 3.

Stochastic EPSC amplitude increases the dynamic range of synaptic transmission. A–D, Representative dynamic-clamp recording. A, Synaptic conductances used to drive dynamic-clamp experiments. Synaptic conductances were based on EPSCs measured in separate voltage-clamp experiments shown in Figure 2A–C. On different dynamic clamp trials, either the overall average amplitude (left, average of 20 trials) or amplitudes measured on individual trials (right shows five examples) were convolved with a unitary EPSC (left, inset). B, Sample dynamic clamp trials, with conductances drawn from the overall average EPSC on each trial (left), or the EPSC amplitudes measured in individual trials (right, each trace uses a unique set of conductances, shown in A). Spiking was highly repeatable using the average conductance compared with the individual conductances. For the average conductance (left), the 39th pulse in the 100 Hz train showed nearly 100% reliable spiking (asterisk below traces), whereas the 38th and 40th failed to elicit spikes, even though differences in the average conductance are imperceptible over this range (A). Spiking was much more variable when using the conductances from individual trials (right). Arrowheads to the left of traces indicate −60 mV. C, Raster diagram of spike times from 32 trials using the average (left) or individual (right) conductances. Continuous vertical lines indicate highly regular firing. D, Pspike for dynamic clamp trials driven with average versus individual conductance for 100 Hz trains, calculated from the rasters in C. The average conductance led to sharp oscillations in Pspike (closed circles) compared with the individual conductances (open circles), which showed a gradual decline. E, Relationship between Pspike and average pulse conductance GAMPA. GAMPA was the same for dynamic clamp conductances based on either individual voltage-clamp trials (A–C, right) or the overall average (A–C, left) for trains of 50, 100, and 200 Hz. Pspike values are derived from the same analysis as in D but are plotted against the average conductance for that pulse. Lines are sigmoidal fits to the data using Equation 1, and the derived measure of dynamic range is indicated by the dumbbells above the graph. F, Pspike as a function of conductance amplitude, regardless of position in the train. Synaptic conductances from the experiments of A and B were sorted by amplitude across all trials, then binned to calculate Pspike. Data from average trials are shown with solid symbols, and from individual trials are shown with open symbols. Lines are sigmoidal fits to the data as in E, with dynamic ranges indicated by the dumbbells above the graph. The average difference in dynamic range was 0.32 ± 0.10, which was not significant (p = 0.12, N = 7 cells). G, Dynamic range increased when stochastic properties of neurotransmitter release were included in dynamic-clamp trials. We fit sigmoidal curves (Eq. 1) to measure the dynamic range for individually variable trials (open circles, open bars) and the average trials (closed circles, solid bars). The dynamic range increased significantly when considering Pspike as a function of average conductance amplitude for individual pulses (p < 0.001), but not when considering Pspike as a function of conductance amplitude regardless of train position (p = 0.12). Data are averages from seven cells.
