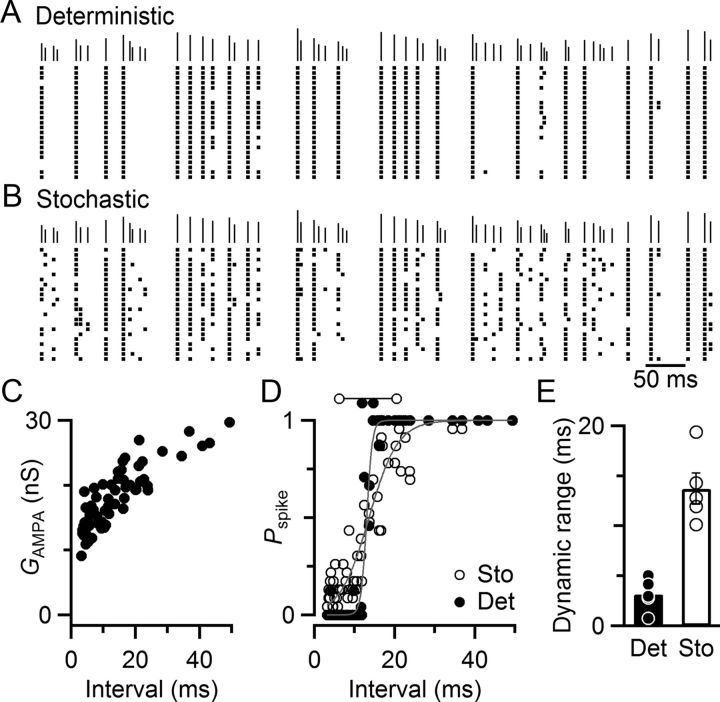
Figure 6.
Stochastic properties of release uncover high-frequency activity. A–D, Data from a representative dynamic-clamp experiment using a 75 Hz Poisson-distributed train of activity to drive the conductance model. A, B, Responses of a BC driven by deterministic (A) or stochastic (B) model conductances. The actual (A) or average (B) conductances are shown above the rasters. For scale, the final conductance in the train was 20 nS. With the deterministic model (A), responses were highly bimodal, either reliably firing or reliably failing to fire on nearly every trial. By contrast, responses to the stochastic model (B) were much more variable. Many pulses produced spikes in B that failed to do so in A. Responses are shown at steady state, beginning with the 10th pulse. C, Conductances at short intervals tended to be smaller. Conductance amplitudes were from the deterministic model. D, Pspike as a function of preceding interval, revealing a wider dynamic range for trials using the stochastic model (open circles) compared with the deterministic model (closed circles). Lines are sigmoid fits to the data to quantify the dynamic range, which is indicated using dumbbells above the graph. E, Average dynamic ranges from five experiments using deterministic (closed circles, solid bar) and stochastic models (open circles, open bar). The increase is statistically significant (p = 0.003, t test).

