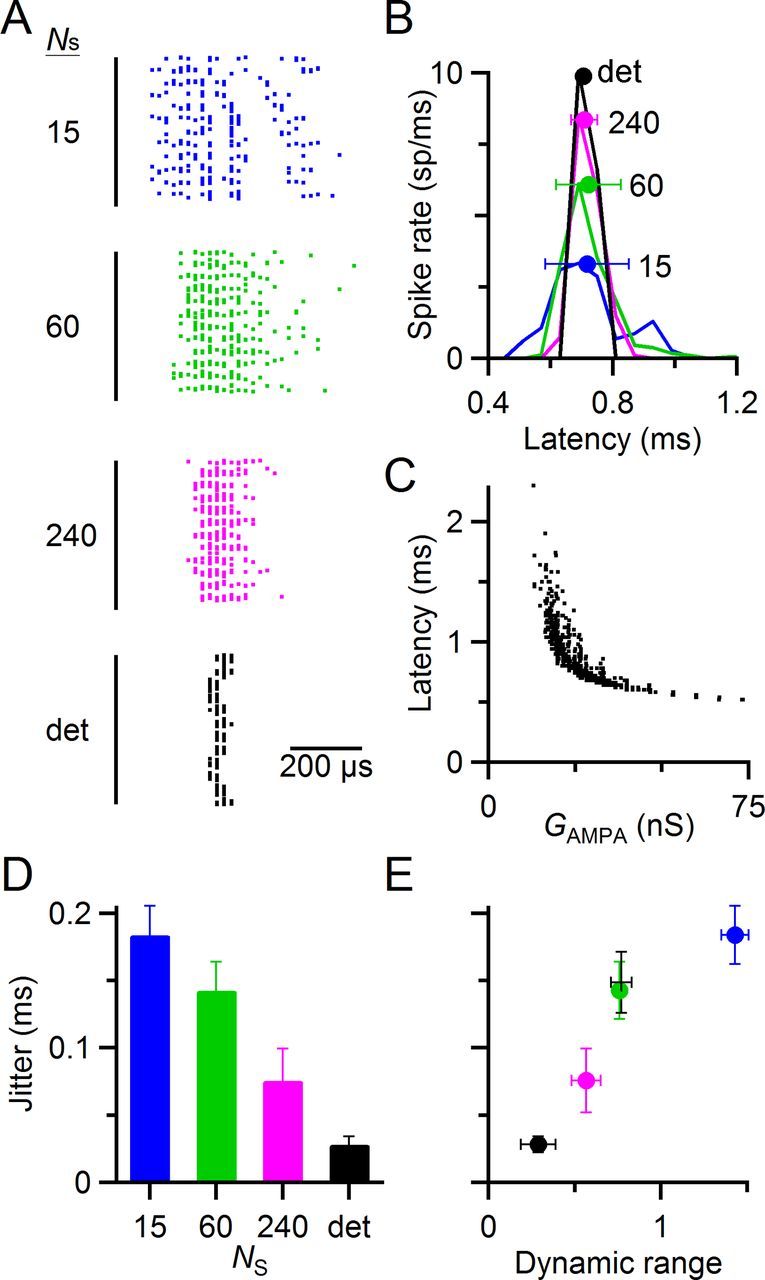
Figure 7.

Increased variability also drives an increase in jitter, causing a trade-off. A–C, Data from a representative dynamic-clamp experiment illustrating the effects of synaptic variability on jitter. A, Spike latency after synaptic conductances in regular, 50 Hz trains (similar to the experiments of Fig. 5). Each horizontal line shows the spike latencies from steady-state pulses 11–40 of a single trial all overlaid, with a small vertical displacement to avoid perfect overlap. Spike latencies have a resolution of 20 μs. The black line at left indicates the time of the peak of the synaptic conductance (Fig. 3A, left, inset). The variability of synaptic conductances was controlled by changing the number of release sites (NS). Spike latencies were more variable for smaller NS (i.e., more variable conductance amplitude). The deterministic model had the least jitter. B, Latency histogram of spikes from A. Markers indicate overall mean and SD of the latency. The mean was unaffected by the variability of synaptic conductance, but the SD (i.e., the jitter) increased with decreasing NS. C, Effect of individual synaptic conductance GAMPA on spike latency. Spike latency is inversely related to GAMPA. Thus, variability in synaptic conductance results in variability in spike latency. D, Spike jitter as a function of the number of release sites, from five experiments similar to A–C. E, Trade-off in spike jitter and dynamic range. As dynamic range increases, so does jitter. Jitter data are from D, and dynamic range data are from Figure 5D. The measurements of dynamic range and jitter from current-clamp experiments in Figure 8 are also included for comparison (black +).
