Figure 8.

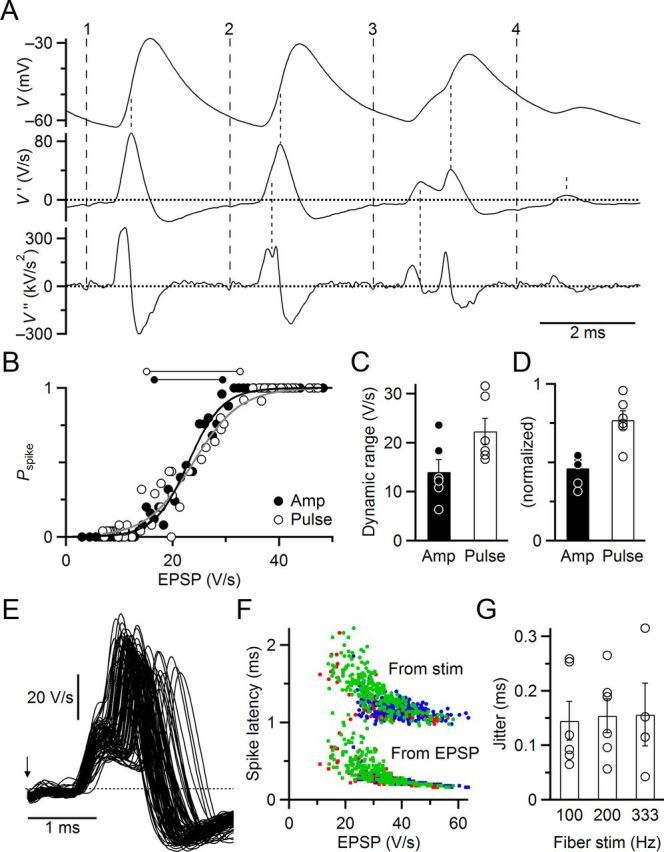
Dynamic range and jitter for real fiber stimulation match dynamic-clamp experiments. A, Measuring EPSP amplitudes. Traces are raw membrane potential (V, top) and first (V′, middle) and second (V″, bottom) derivatives. Broad-dashed lines indicate fiber stimulation times (stimulus artifact was small in this example). Fine-dashed lines indicate times of EPSPs and spikes as used for subsequent analyses. All traces are filtered at 5 kHz. B, Dynamic range. Average Pspike was calculated for individual pulses in trains of 100, 200, and 333 Hz stimulation rates and plotted against the average EPSP amplitude (open circles). This relationship was fit to Equation 1 to estimate the dynamic range (open dumbbells above the plot). To estimate the deterministic dynamic range, we sorted EPSPs by amplitude before calculating Pspike and average EPSP (closed circles). C, Average dynamic ranges from six similar experiments averaging by EPSP amplitude (closed circles, solid bar) or train pulse (open circles, open bar). The increase is statistically significant (p < 0.001, t test). D, Same data as C, but normalized to spike threshold (EPSP1/2), to facilitate comparison with dynamic-clamp experiments. E, BC spike jitter in the same cell as A and B. All successful spikes are overlaid for pulses 11–20 in 200 Hz trains (86), which cover a wide range of EPSP amplitudes. The EPSP latency is quite constant, whereas spikes are extremely variable. The arrow indicates the stimulus time. F, Spike latency for the same cell as A, B, and E. Latency was measured from the stimulus (upper circles) or the EPSP (lower squares). All spike times are shown for 100 (blue), 200 (green), and 333 (red) Hz stimulation. Both methods indicate that latency is highly inversely dependent on EPSP amplitude. G, Average spike jitter in six experiments for pulses 11–20 of 100, 200, and 333 Hz trains. In two cells, spike probability was too low to measure jitter at 333 Hz stimulation.
