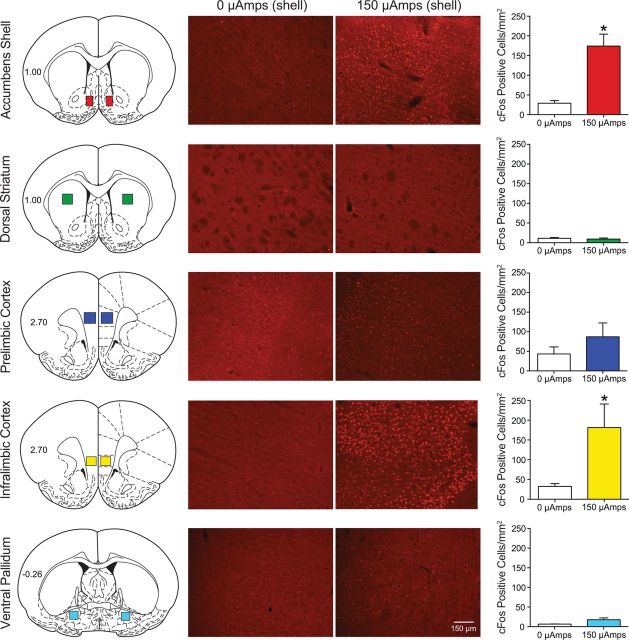
Figure 3.
DBS of the nucleus accumbens shell induces c-Fos expression in the nucleus accumbens shell and the infralimbic prefrontal cortex. All animals received bilateral nucleus accumbens shell DBS (0 or 150 μA) for 30 min. Animals were perfused 70 min from the start of stimulation, and c-Fos immunoreactivity was measured to assess neuronal activation following accumbens DBS. Figure 3 shows a representative cartoon depicting the area of c-Fos staining quantification from the five brain regions where c-Fos was counted (nucleus accumbens shell, dorsal striatum, prelimbic cortex, infralimbic cortex, and ventral pallidum), a representative image from both the 0 and 150 μA condition, and the quantification (mean ± SEM c-Fos-positive cells per square millimeter). *p < 0.05 0 μamps compared with 150 μamps. There were five animals per group.

