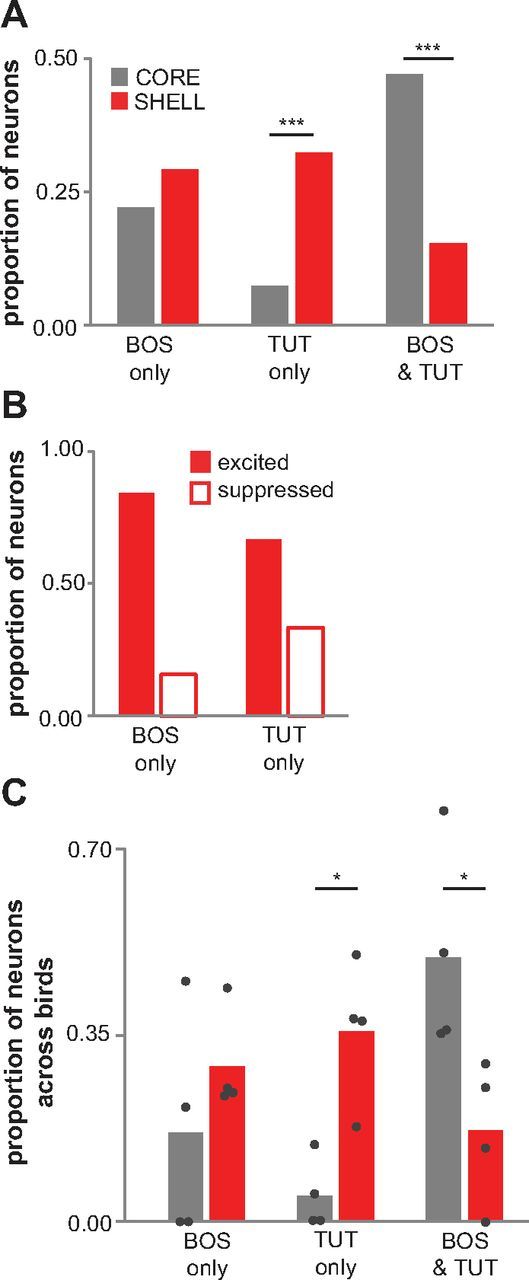
Figure 3.

A population of neurons in LMANshell of 45 dph birds responds only to tutor song. A, Among all neurons that were tested with playback of BOS, REV, and TUT: absolute proportions of neurons that responded to BOS only, TUT only, or both BOS and TUT in LMANcore (gray; n = 68) and LMANshell (red; n = 65). For this analysis, “BOS only” included neurons that showed a significant response to BOS and not to REV or TUT (see Materials and Methods), “TUT only” included neurons that responded only to TUT and not to BOS or REV, and “BOS & TUT” includes neurons that responded to both BOS and TUT (regardless of whether there was a response to REV). Shell neurons in all three response categories include cells that showed either rate increases or decreases (see Results); analysis conducted on only excited neurons yielded highly similar results (data not shown). ***p ≤ 0.001. B, Among all shell neurons included in A, proportions of neurons that were either excited (filled bars) or suppressed (open bars) by BOS only or TUT only. C, Among all neurons included in A, mean proportion of neurons averaged across each bird that responded to BOS only, TUT only, or both stimuli in LMANcore (gray) and LMANshell (red). Data from individual birds are plotted as dots (n = 4 birds; not included are data from one bird that did not receive the TUT stimulus and from one bird from which we recorded one BOS/TUT-responsive neuron). The mean proportion of TUT-only neurons per bird was higher in shell than in core (p = 0.019, Mann–Whitney test), and the mean proportion of BOS & TUT neurons per bird was higher in core than in shell (p = 0.021, Mann–Whitney test). *p < 0.05. These data show that the differences between core and shell computed across individual birds were also significant and match those computed across neurons.
