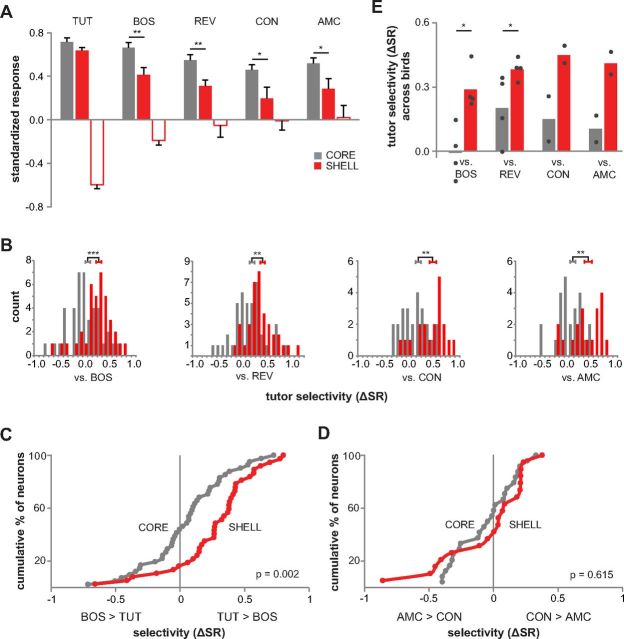
Figure 6.
Response strength and selectivity across all TUT-responsive neurons in LMANshell and LMANcore of 45 dph birds. TUT-responsive neurons include all those that showed a significant response to TUT (either alone or in combination with other song stimuli, includes both TUT-excited and TUT-suppressed neurons). A, SRs for TUT-responsive neurons in core and shell to TUT, BOS, REV, adult CON, and AMC. Filled bars show mean response of neurons that were excited by TUT (core, n = 41 for TUT, BOS, and REV and n = 24 for CON and AMC; shell, n = 28 for TUT, BOS, and REV and n =12 for CON and AMC), and open bars show mean response of neurons that were suppressed by TUT (core, n = 0; shell, n = 9 for TUT, BOS, and REV and n = 7 for CON and AMC). Error bars indicate SEM. *p < 0.05, **p < 0.01, and ***p < 0.001. B, Histograms showing distributions of selectivity (ΔSR) scores for TUT versus other songs (excited and suppressed responses combined) in core and shell (core, n = 41 vs BOS and REV, n = 24 vs CON and AMC; shell, n = 37 vs BOS and REV, n = 19 vs CON and AMC). The sign of selectivity scores for suppressed neurons is reversed. Error bars are centered on mean values and indicate SEM. C, D, Cumulative distributions of TUT–BOS ΔSR scores (core, n = 41; shell, n = 37) and of CON–AMC ΔSR scores (core, n = 24; shell, n = 19); p values shown are from Kolmogorov–Smirnov Z tests for difference between the distributions. E, TUT selectivity averaged across birds to compare with means averaged across neurons (B). Bars show mean selectivity for TUT over other songs across birds in core (gray) and shell (red). Data for individual birds are plotted as dots. Mean selectivity scores per bird were higher in shell than in core for comparisons with both BOS and REV (p = 0.02 and 0.04, respectively, Mann–Whitney test; n = 5 birds vs BOS and vs REV, one bird had recordings only in core and one bird had recordings only in shell; not included are data from one bird that did not receive the TUT stimulus; n = 2 birds vs CON and vs AMC). These data show that mean values do not differ, regardless of whether values are computed based on means of individual birds or across all neurons.

