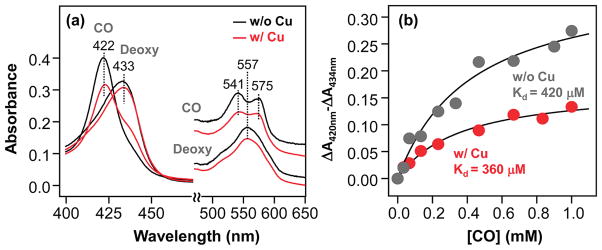
Figure 2.

Optical absorption spectra of the deoxy and CO-bound derivatives of CuBMb (a) and the CO titration curves of CuBMb (b), in the presence and absence of 64 μM Cu+. The solid lines in (b) are the best-fit curves based on a single CO binding site in CuBMb. The Kd of CO was determined to be 420 and 360 μM for the Cu+-free and Cu+-bound CuBMb, respectively. In both cases, full saturation was not achieved even at a CO concentration of 1 mM. The protein concentration was 3.1 μM.
