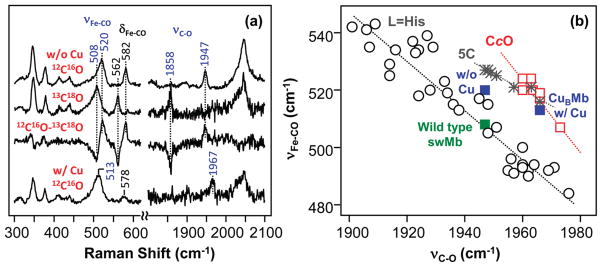
Figure 3.

Resonance Raman spectra of CO-bound CuBMb in the presence and in the absence of 100 μM Cu+ (a) and the νFe-CO versus νC-O inverse correlation plot of the data (b). The top two spectra in (a) were obtained from Cu+-free CuBMb; the bottom spectrum was obtained from Cu+-bound CuBMb, in the presence of either 12C16O or 13C18O. The 12C16O - 13C18O difference spectrum was obtained from the Cu+-free sample. In the difference spectrum all the heme modes cancel out, while the remaining positive and negative bands are associated with 12C16O- and 13C18O-related modes, respectively. The data shown in the νFe-CO versus νC-O inverse correlation plot in (b) are taken either from this work or from refs 40, 52, and 53.
