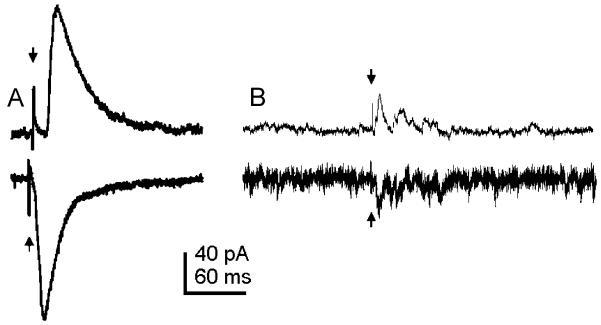
Fig. 1.
Electrical stimulation of the NTS evoked EPSCs and IPSCs in DMV neurons. (A) Electrical stimulation of the NTS (arrows) resulted in a single constant-latency eIPSC (top trace) or eEPSC (bottom trace). An average of 14 traces from a whole-cell recording of a DMV neuron voltage-clamped at −20 mV (top) and 12 traces from a whole-cell recording of a different DMV neuron voltage-clamped at −75 mV (bottom) are shown. (B) Electrical stimulation of the NTS (arrows) resulted in a transient increase in frequency of IPSCs (top trace) or EPSCs (bottom trace). Both traces were obtained from the same neuron voltage-clamped at −20 mV (top) and −60 mV (bottom).

