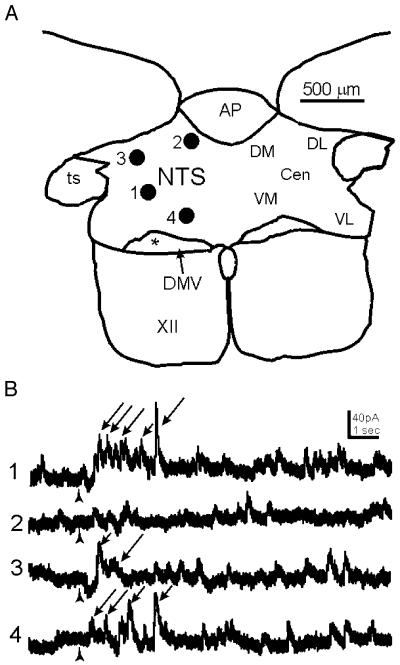
Fig. 5.
Uncaging glutamate in discrete loci of the NTS evoked IPSCs in the DMV. (A) Diagram showing a representative transverse slice through the brainstem containing the dorsal vagal complex from which a DMV neuron was recorded. Numbered filled circles correspond to discrete loci where glutamate was uncaged in the slice. (B) Traces obtained from a whole-cell recording of a DMV neuron voltage-clamped at 0 mV. The numbers to the left correspond to the loci in the NTS where glutamate was uncaged. The time of uncaging is indicated by the arrowhead. Positions 1, 3 and 4 show examples of increased IPSC frequency following photostimulation in the NTS (arrows).

