
Figure 2.
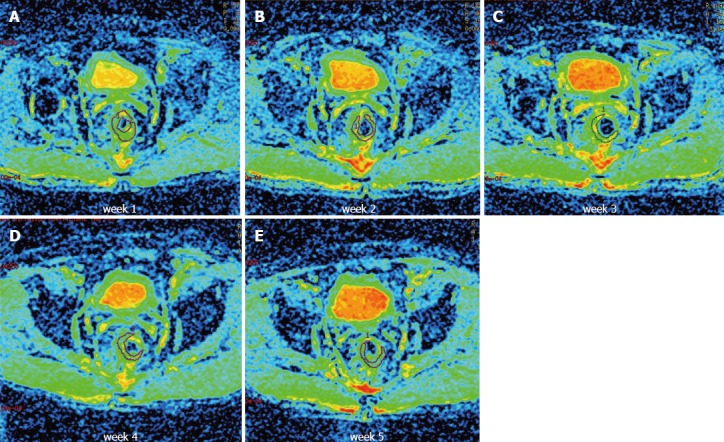
Apparent diffusion coefficient maps of one patient obtained at constant intervals once weekly during the course of neoadjuvant treatment from the diffusion-weighted images. A-E: Axial apparent diffusion coefficient maps obtained during treatment (weeks 1-5). A region of interest was drawn around the tumor.