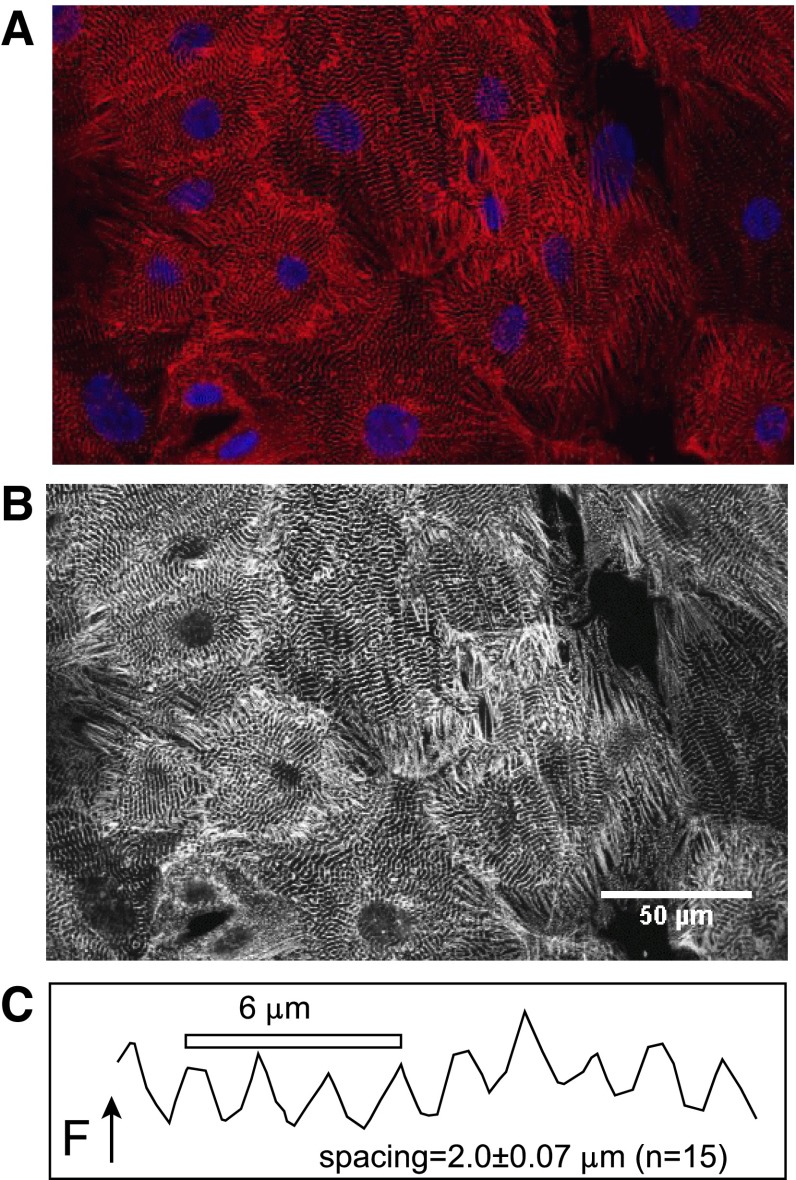
Fig. 1.
iCell Cardiomyocytes stained with EA-53 anti-sarcomeric α-actinin antibody and mouse monoclonal secondary-CY5 together with DAPI nuclear staining. A: dual fluorescence image of iCell Cardiomyocyte culture illustrating myofilaments and mononucleation of cells. B: high contrast black and white depiction of the same image to illustrate myofilament arrangements. C: typical α-actinin spacing from the black and white image determined from fluorescence, F, profiles along lines passing perpendicularly through striations. From 15 similar measurements, the average spacing was 2.0 ± 0.07 μm.

