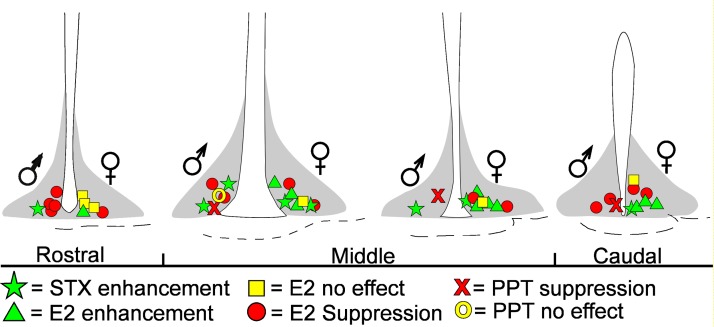
Fig. 6.
Representative drawings of the 4 coronal slices through the mouse hypothalamus show the location of NPY/AgRP neurons that responded to E2, the ERα agonist PPT, or the Gq-mER ligand STX in intact males and OVX females. Left or right side of ventricle represents cell locations in males or females, respectively. Shaded area depicts ARC.

