Fig. 4.
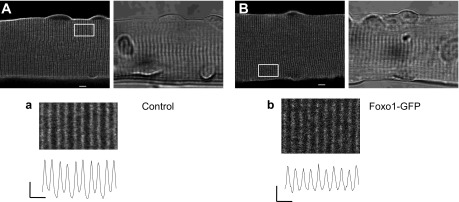
Transverse (T)-tubule arrangement and distribution as well as overall fiber morphology remain unaltered in fibers expressing Foxo1-GFP. Representative confocal (left) and transmitted light images (right) of a control fiber (A) or a fiber expressing Foxo1-GFP (B) cultured for 48 h and then stained with pyridinium,4-{2-[6-(dioctylamino)-2-naphthalenyl]ethenyl}-1-(3-sulfopropyl)-inner salt (di-8-ANEPPS). In control fibers (n = 14, N = 3), T-tubules are organized in a regular striated pattern, characterized by a ∼2-μm sarcomere length and ∼1 μm T-tubule “doublet” spacing. No changes in T-tubule morphology are seen in fibers expressing Foxo1-GFP (n = 18, N = 4). N indicates number of mice per condition, and n indicates number of fibers imaged. Scale bars in A and B = 5 μm. a and b, bottom: zoom-in versions of boxed regions indicated in A and B. Traces below zoom-in images are averaged fluorescence profiles across the box: vertical scale bar = 500 arbitrary units; horizontal scale bar = 2 μm.

