Fig. 8.
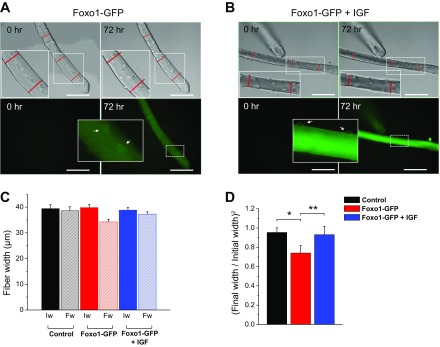
In vitro time-lapse study of atrophy in single FDB muscle fibers. Cultured FDB fibers were infected with a Foxo1-GFP adenoviral vector and incubated in the absence or presence of 100 ng/ml IGF-1 for 72 h. Foxo1-GFP signal was used to monitor Foxo1 expression and location. A: transmitted light images (top) and wide-field fluorescence images (bottom) of a representative muscle fiber after infection with Foxo1-GFP adenovirus showing the same fiber observed at the beginning of the time-lapse experiment (time 0; left) and after 72 h (right). B: transmitted light images (top) and wide-field fluorescence images (bottom) of another representative muscle fiber after infection with Foxo1-GFP adenovirus and treated with IGF-1 (100 ng/ml) showing the same fiber observed at the beginning of the time-lapse experiment (time 0; left) and after 72 h (right). Scale bars = 100 μm. Red lines in A and B indicate fiber width measurements from three different locations along the length of the fiber at time 0 and reused on panels from 72 h. Note the reduction on fiber width after 72 h in fibers expressing Foxo1-GFP. Insets are zoom-in versions of dashed regions. Arrows in A, bottom, show Foxo1-GFP nuclear localization, whereas arrows in B, bottom, show weaker Foxo1-GFP nuclear localization. C: summary of fiber width measurements for control fibers (n = 12, N = 3), fibers infected with Foxo1-GFP (n = 20, N = 3), and fibers expressing Foxo1-GFP and treated with IFG-1 (n = 24, N = 3). N indicates number of mice per condition, and n indicates number of fibers tested. The average width per fiber was calculated as the mean of 3 measurements taken along the length of the fiber at the beginning (initial width: Iw) and at the end (final width: Fw) of the time-lapse experiment. D: summary of fiber size measurements. The square of the ratio of the final width/initial width (final width/initial width)2 was used to quantify the change in muscle fiber diameter. Note the significant reduction of fiber size after 72 h in fibers expressing Foxo1-GFP. *P < 0.05, compared with control fibers. **P < 0.05, compared with fibers infected Foxo1-GFP and IGF-1 treated.

