
Fig. 10.
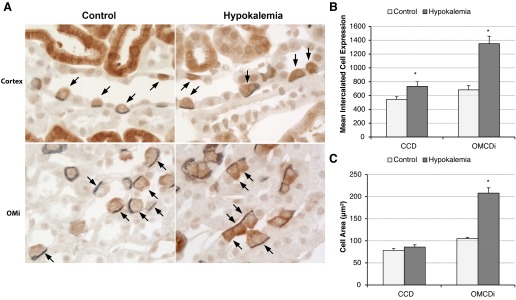
Immunohistochemistry and quantitative analyses demonstrating that hypokalemia increases type A intercalated cell size and GS expression. A: double immunolabel of GS (brown) with AE1 (blue) in collecting ducts of control and hypokalemic mice. In both control (left) and hypokalemic (right) kidneys, there was a one-to-one correlation between GS expression and AE1 expression, identifying GS-positive cells as type A intercalated cells. In response to hypokalemia, intercalated cells in both the CCD (top) and OMCDi (bottom) appeared to be hypertrophied and exhibited increased GS immunolabel. B: quantitative analysis of GS immunolabel intensity (in arbitrary units) in individual intercalated cells in the CCD and OMCDi. Hypokalemia induced significant increases in GS expression in type A intercalated cells in both the CCD and OMCDi. C: quantitative analysis of the type A intercalated cell profile area. Hypokalemia induced a significant increase in the OMCDi intercalated cell profile area. n = 4 hypokalemic kidneys and 4 control kidneys for each comparison. *P < 0.05.