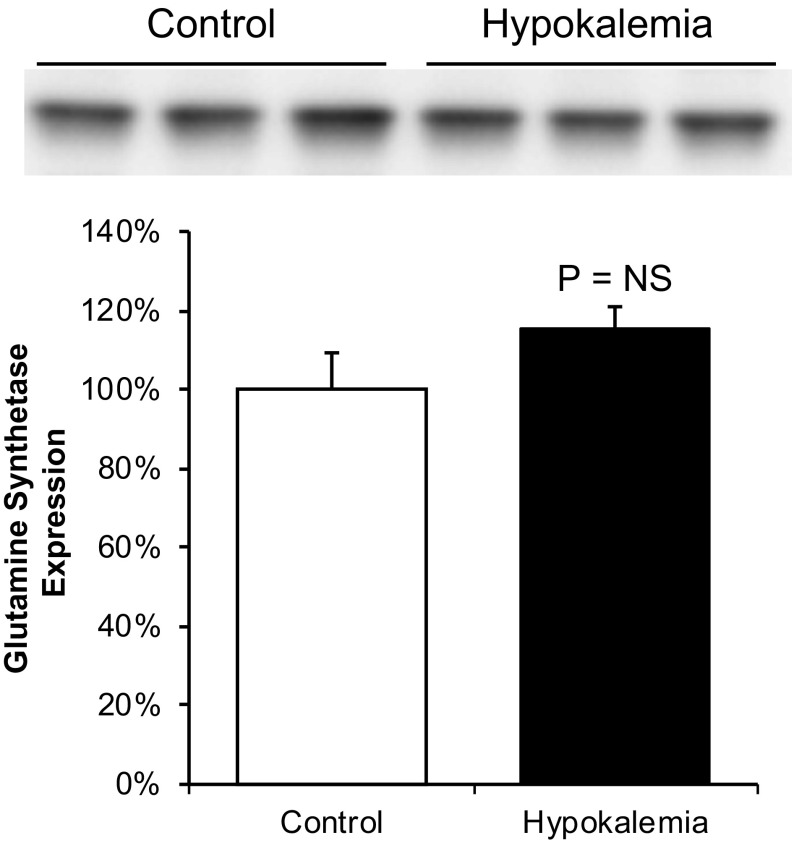
Fig. 11.
Immunoblot analysis of GS expression in the OMi in response to hypokalemia. Top: GS expression in the OMi of control and hypokalemic mice. Bottom: quantitative analysis. Hypokalemia did not significantly alter GS expression relative to total protein expression [n = 3 in each group, P = not significant (NS) by t-test]. Since hypokalemia induced hypertrophy and concomitantly increased total protein expression in the OMi, these results indicate increased total GS expression.

