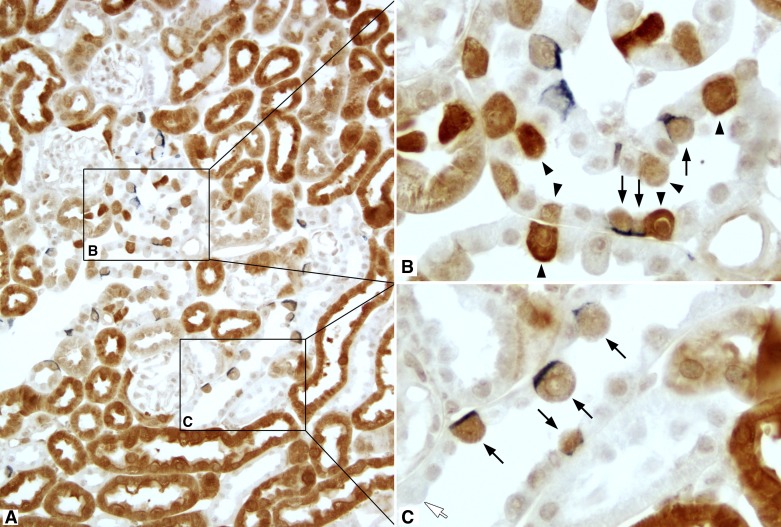
Fig. 6.
GS and AE1 double label in the cortex. A: low-power micrograph of GS (brown) and AE1 (blue) immunolabel in the mouse cortex. B and C: selected areas (boxes) at higher magnification. In the connecting tubule (CNT; B), all cells with basolateral AE1 immunolabel expressed GS (arrows). In addition, there was a population of GS-positive cells that did not express detectable AE1 (arrowheads). In the CCD (C), all GS-positive cells expressed basolateral AE1 (arrows). In addition, there was a subpopulation of CCD cells with the morphological appearance of intercalated cells that did not express detectable GS immunolabel (white arrow).

