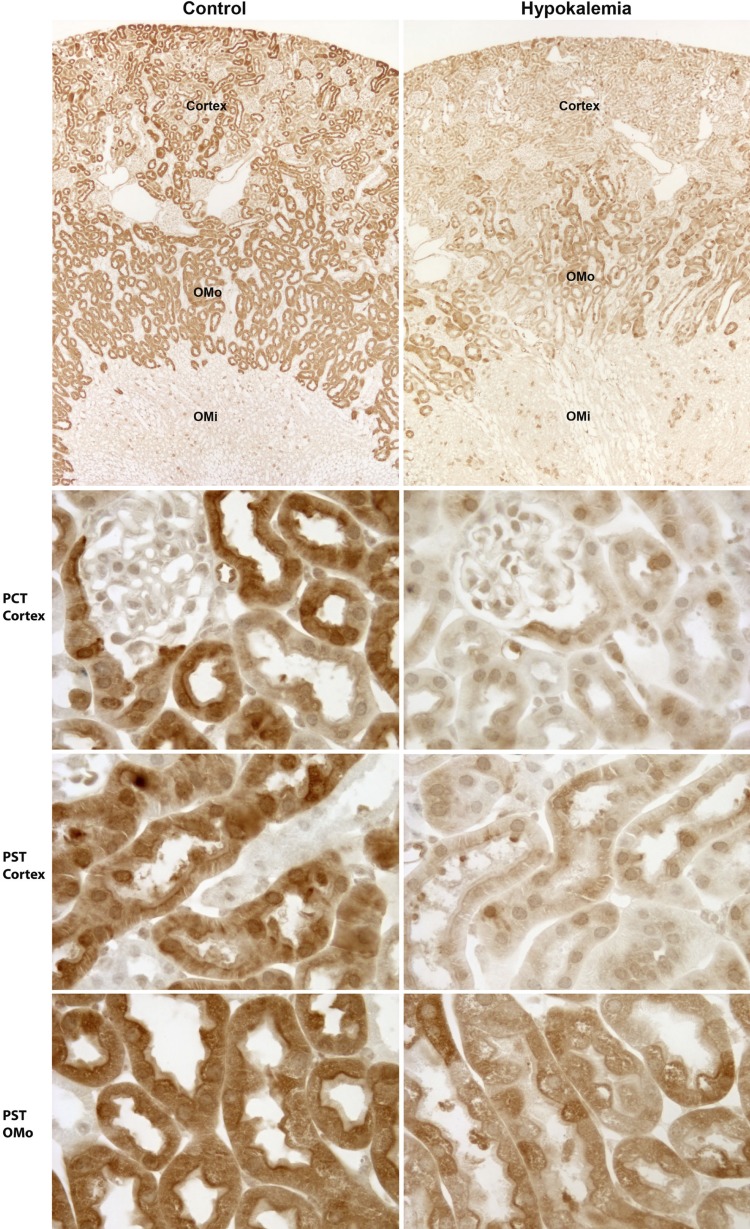
Fig. 8.
Immunohistochemistry showing the effect of hypokalemia on GS expression in PTs. Left: control kidney; right: hypokalemic kidney. Top: low-power micrographs of GS immunolabel in control and hypokalemic kidneys. A dramatic decrease in GS immunolabel in the cortex and OMo, regions where proximal tubules predominate, was evident. Middle top, middle bottom, and bottom: higher-power micrographs of GS immunolabel in proximal convoluted tubules (PCT) in the cortex and PSTs in the cortex and OMo of control and hypokalemic mice. A marked and widespread decrease in GS expression in response to hypokalemia was evident in PCTs and PSTs. Control and hypokalemia tissues were preserved, embedded, and immunolabeled in the same experiments using identical procedures and were visualized and photographed in the same session using the same microscope and camera settings.

