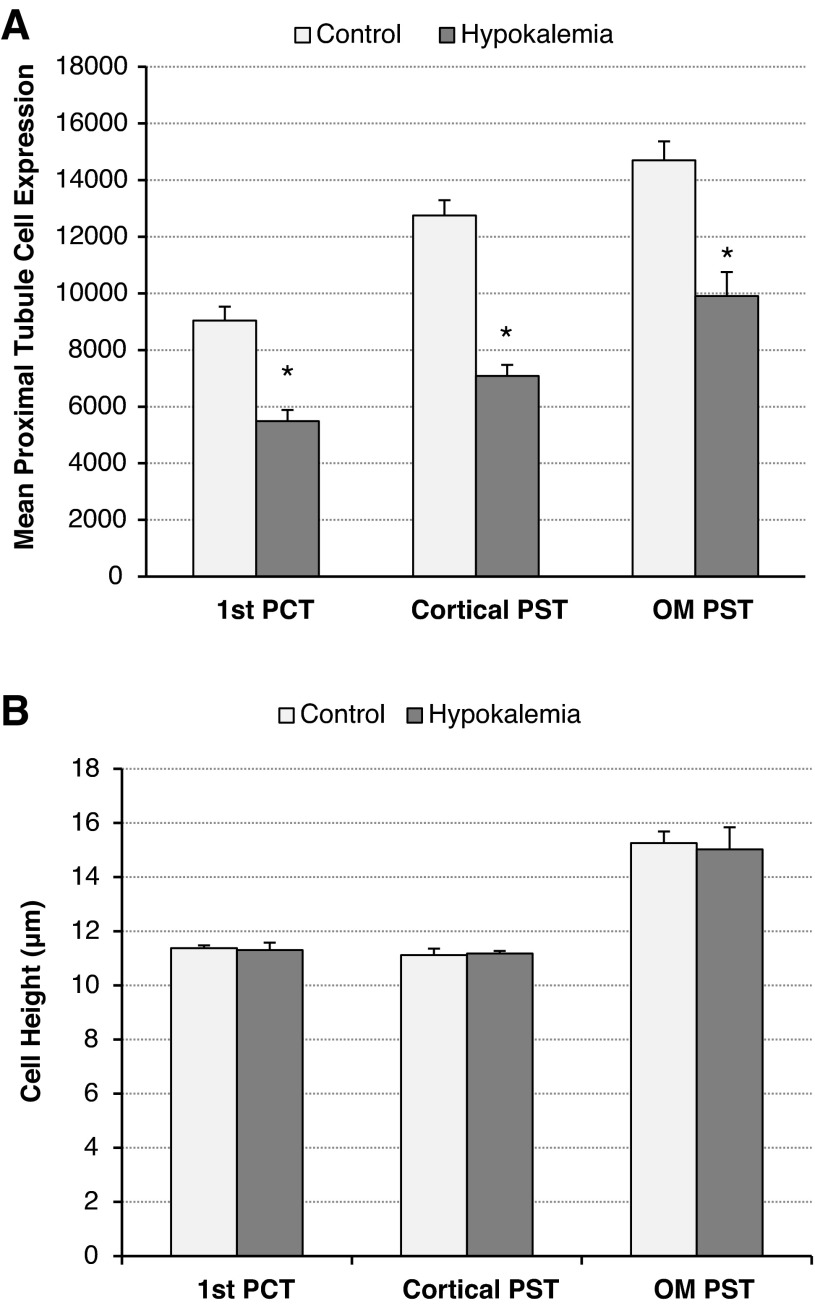
Fig. 9.
Quantitative analyses of GS immunohistochemistry in the PT. A: mean PT cell expression. B: cell height. Quantitation of GS immunolabel in three segments of the PT demonstrated a significant decrease in GS immunoreactivity in each of these tubule segments after 12 days of K+-free diet. The segments analyzed were the portion of the PCT continuous with Bowman's capsule (1st PCT), the PST in the medullary ray (cortical PST), and the PST in the OMo (OM PST). n = 4 hypokalemic kidneys and 4 control kidneys for each comparison. *P < 0.05.

