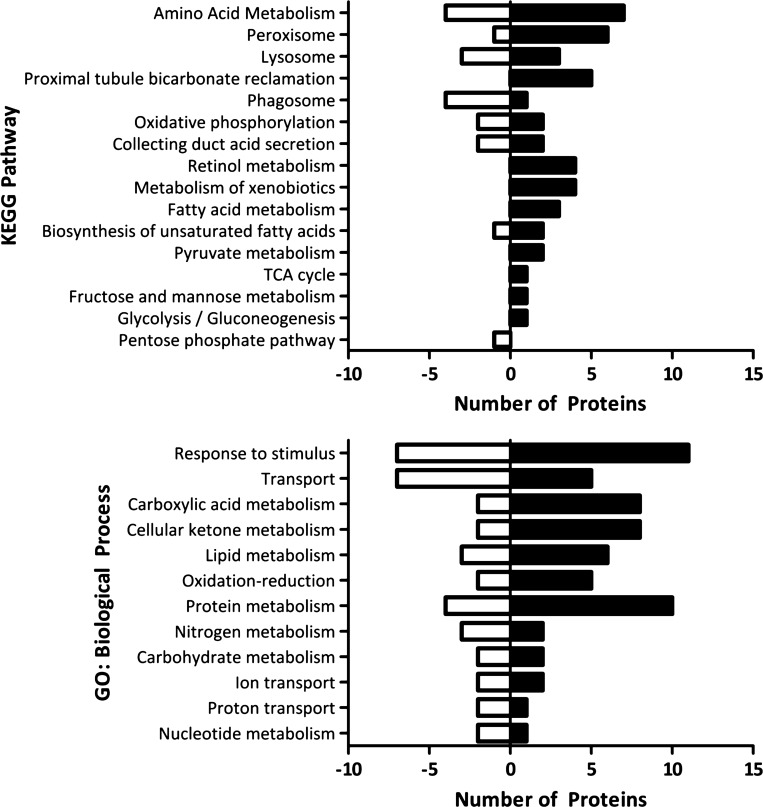
Fig. 8.
Pathways and biological processes that are up- or downregulated in the proximal convoluted tubule during metabolic acidosis. Black bars to the right of the x-axis represent the number of proteins involved in the pathway or process that were upregulated during acidosis, whereas white bars to the left represent the number of downregulated proteins. Data from cytosolic, mitochondrial (11), and apical membrane (44) fractions were concatenated before analysis.

