
Fig. 1.
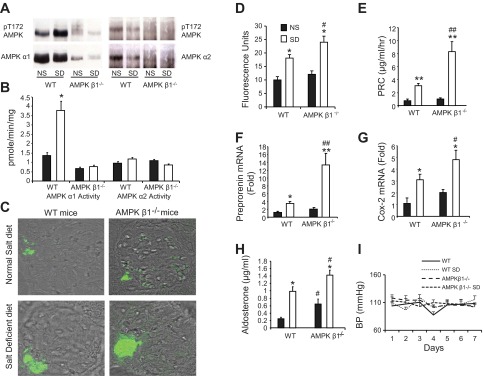
Renin response in AMP-activated protein kinase (AMPK) β1-subunit knockout (AMPK-β1−/−) mice that received a salt-deficient diet (SD). Knockout mice and wild-type (WT) control littermates were fed a normal diet (ND) or SD for 7 days. A: representive Western blots for phosphorylated (p)Thr172 (pT172) from kidney cortical lysates immunoprecipitated for either AMPK α1- or α2-catalytic subunits. B: AMPK activity assay performed on kidney cortical lysates. C: representative confocal microscopy images of immunofluorescence labeling of renin expression in AMPK-β1−/− and WT control littermates fed the ND and SD. D: quantitation of total fluorescence of renin expression. n = 5 (10 images from each kidney). E: plasma renin concentrations (PRC). n = 11. F: preprorenin mRNA measured using real-time PCR and expressed as fold changes relative to WT mice fed the ND. n = 11. G: cyclooxygenase (Cox)-2 mRNA measured using real-time PCR and expressed as fold changes relative to WT mice fed the ND. n = 11. H: plasma aldosterone concentration in mice fed the ND and SD. n = 11. I: systolic blood pressure (BP) measured by the tail-cuff technique. n = 7–15. *P < 0.05 and **P < 0.001 for mice on the SD compared with the ND; #P < 0.05 and ##P < 0.001 for AMPK-β1−/− mice compared with WT mice on the same diet.