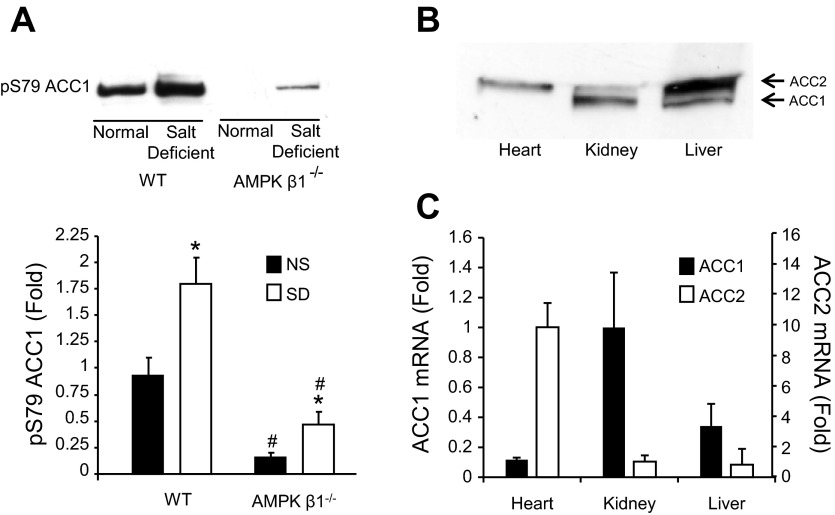
Fig. 5.
Acetyl-CoA carboxylase 1 (ACC1) phosphorylation in mice that received the SD. A: Western blots of kidney lysates from AMPK-β1−/− mice or littermate control mice on the ND or SD for 7 days and the corresponding densitometric analysis (n = 6). Lysates were standardized by equal protein loading as measured by the Bradford protein assay. *P < 0.05 for mice on the SD compared with ND; #P < 0.05 for AMPK-β1−/− mice compared with WT mice on the equivalent diet. B: comparative expression levels of ACC1 and ACC2 by Western blot analysis of heart kidney and liver lysates from control mice. C: real-time PCR analysis of ACC1 and ACC2 expression from heart, kidney, and liver samples from control mice.

