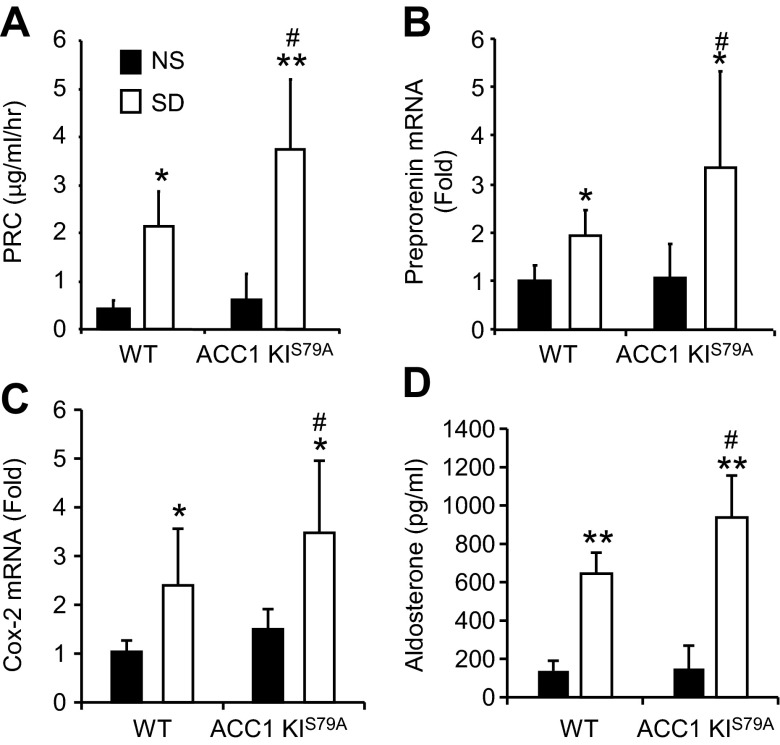
Fig. 6.
Renin response in ACC1-knockin (KI)S79A mice that received the SD. ACC1-KIS79A and littermate control mice were fed the ND or SD for 7 days. A: PRC in ACC1-KIS79A and WT littermate control mice fed the ND and SD. B: preprorenin mRNA measured using real-time PCR and expressed as fold changes relative to WT mice fed the ND. C: Cox-2 mRNA measured using real-time PCR and expressed as fold changes relative to WT mice fed the ND. D: serum aldosterone levels (expressed in pg/ml). n = 11–15. *P < 0.05 and **P < 0.001 for mice on the SD compared with mice of the same strain on the ND; #P < 0.05 for ACC1-KIS79A mice compared with WT mice on the same diet.

