Fig. 1.
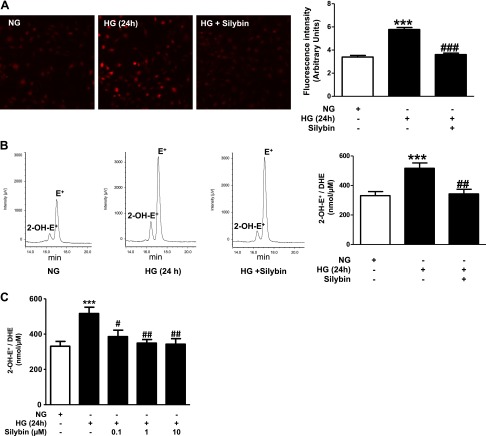
Silybin inhibits high glucose (HG)-induced superoxide generation. Exposure of mouse podocyte cultures to normal glucose (NG; 5 mM glucose) or to HG (25 mM glucose) with or without 10 μM silybin. Assessment of superoxide generation with the dihydroethidium (DHE) stain using 2 different methods: A, left: representative fluorescence microscopic images of podocytes after incubation with 10 μM DHE for 15 min. A, right: bar graph of semiquantitative analysis of the DHE fluorescence (means ± SE of 3 different experiments). ***P < 0.0001 HG vs. NG; ###P < 0.0001 HG vs. HG + silybin. B, left: representative HPLC elution profiles of the dihydroxyethidium (2-OH-E+) peak, a DHE byproduct specific for superoxide generation, and the nonspecific ethidium (E+) peak in cells extracts from cultured podocytes. B, right: bar graph of quantitative analysis of 2-OH-E+ generation (means ± SE of 4 different experiments each experiment in triplicate). ***P < 0.001 HG vs. NG; ##P < = 0.01 HG vs. HG + 10 μM silybin. Results are expressed as nmol 2-OH-E+/μM consumed DHE. C: dose-dependent response of cultured podocytes to silybin. Cells exposed to HG in the presence of 0.1, 1, or 10 μM silybin or vehicle. 2-OH-E+ generation assessed by HPLC, as in B (***P < 0.001 HG vs. NG; #P < 0.05 HG vs. HG + 0.1 μM silybin; ##P < 0.01 HG vs. HG + 1 μM silybin; ##P < 0.01 HG vs. HG + 10 μM silybin).

