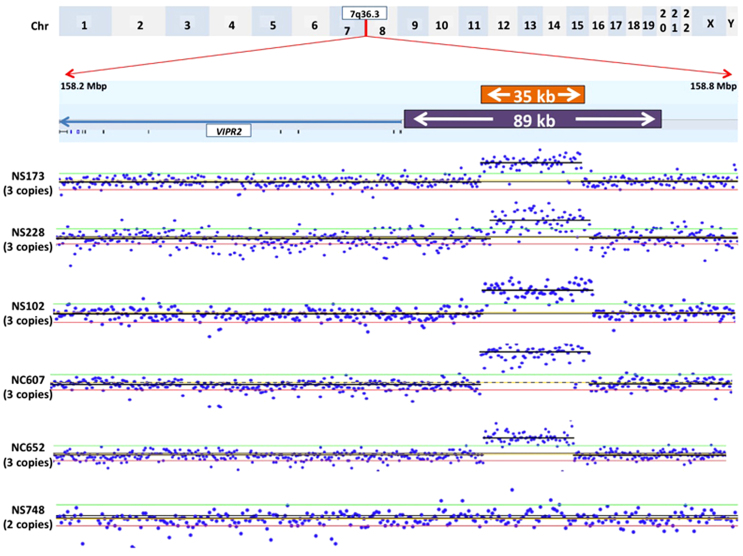
Figure 1. High-resolution aCGH data.
Probe intensity ratios. The orange box (NCBI36/hg18, Chr7: 158,658,128–158,693,128) represents CNVs detected in the present study and the purple box (NCBI36/hg18, Chr7: 158,630,410–158,719,410) represents the region revealed by Vacic et al. to show an association peak in a schizophrenia group. Coordinates are based on the NCBI36 build.

