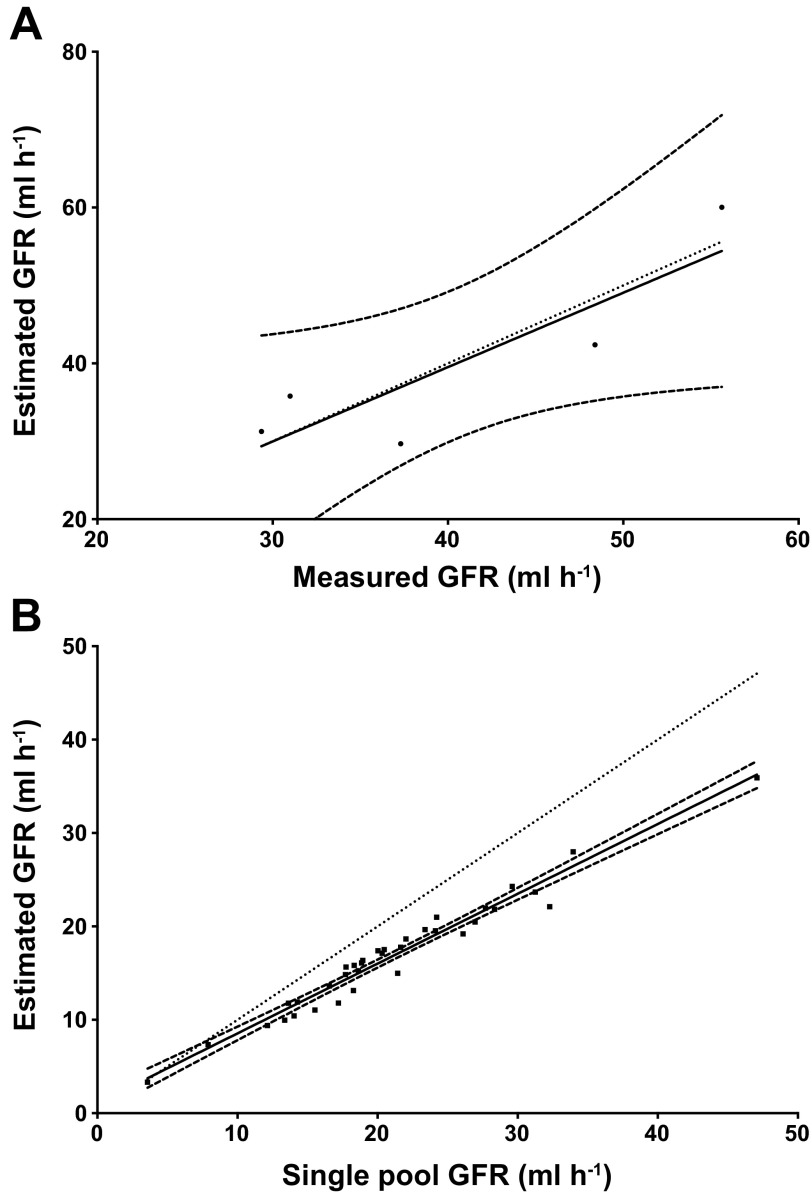
Fig. 2.
A: linear regression of estimated glomerular filtration rate (GFR) against calculated GFR. Estimated GFR was determined using second order exponential decay parameters and Eq. 4 where the rapid phase of the decay curve was estimated from experimentally derived parameters from intravenous injections. Measured GFR represents GFR calculated using Eq. 4 and all experimentally derived parameters. B: linear regression of estimated GFR and single pool GFR for experimental birds (fed, flown, and rest). Estimated GFR utilizes Eq. 4 and the correction factor determined from (A; see text). Relationship between estimated GFR and single pool GFR can be described by the equation: Y = 0.747 (x) + 1.072. In both A and B, the dotted line represents the line of unity, and curved dashed lines represent 95% confidence interval.

