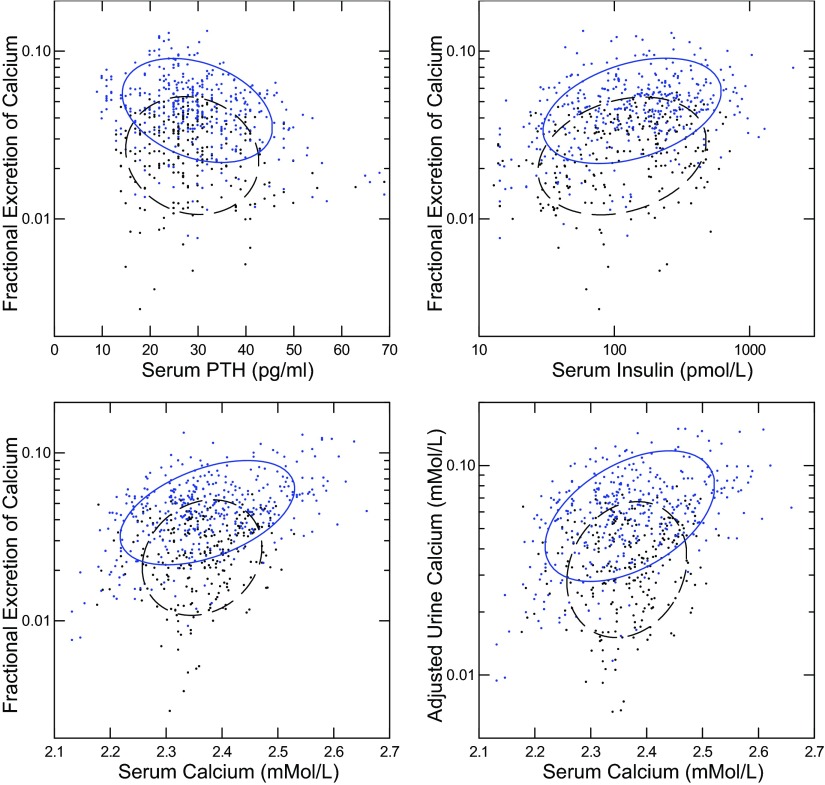
Fig. 1.
Relationships between fractional excretion of calcium (FECa) and parathyroid hormone (PTH), insulin, and serum Ca. Idiopathic hypercalciuria (IH; solid ellipses) and normal subjects (N; dashed ellipses) are plotted together in each panel. Nonparametric ellipses include 68% of points. Regression coefficients are shown with 95% confidence interval (CI) expressed in units to avoid excessive trailing 0s. Significant regressions are bolded; italics denotes that the 95% CI and mean value for N are outside that of IH; values are presented as IH vs. N, respectively. Regression of FECa (%) on PTH/5 pg/ml (top left): −0.32 (−0.41, −0.22) vs. −0.09 (−0.18, 0.08). Regression of FECa (%) on insulin/100 pmol/l (top right): 0.20 (0.10, 0.29) vs. 0.15 (0.04, 0.25). Regression of FECa on serum Ca (bottom left): 0.45 (0.36, 0.54) vs. 0.14 (0.036, 0.244). Regression of adjusted urine Ca (see methods) on serum Ca (bottom right): 0.73 (0.60, 0.86) vs. 0.21 (0.072, 0.35).

