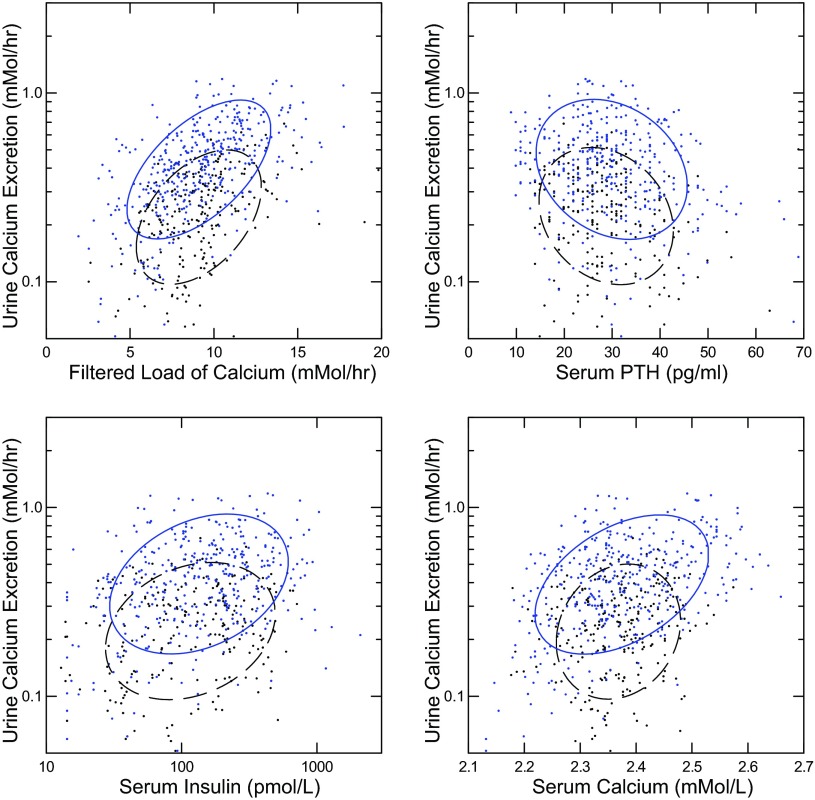
Fig. 2.
Relationships between urine Ca excretion and Ca filtered load, PTH, insulin, and serum Ca. IH (solid ellipses) and N (dashed ellipses) are plotted together in each panel. Nonparametric ellipses include 68% of points. Regression coefficients are shown with 95% CI expressed in units to avoid excessive trailing 0s. All regressions are significant; italics denote that the 95% CI and mean value for N are outside that of IH; values are presented as IH vs. N, respectively. Regression of Ca excretion on filtered load/ml/h (top left): 0.045 (0.038, 0.051) vs. 0.019 (0.015, 0.024). Regression of Ca excretion on PTH/5 pg/ml (top right): −0.25 (−0.35, −0.15) vs. −0.15 (−0.24, −0.06). Regression of Ca excretion on insulin/100 pmol/l (bottom left): 0.14 (0.043, 0.24) vs. 0.16 (0.047, 0.28). Regression of Ca excretion on serum Ca (bottom right): 0.87 (0.66, 1.06) vs. 0.27 (0.054, 0.49).

