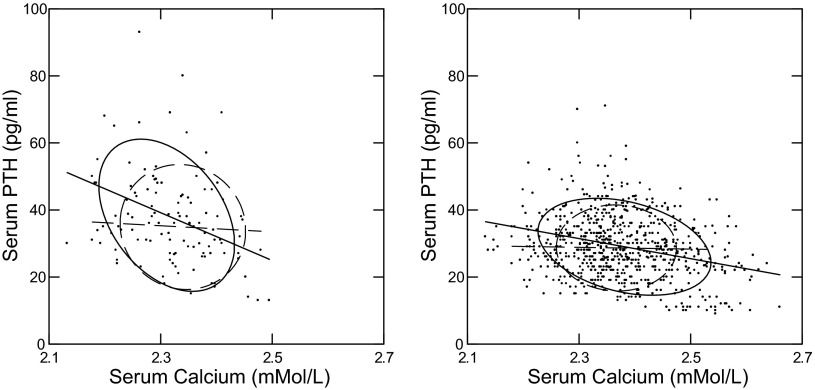
Fig. 3.
Relationships between plasma PTH and serum Ca. IH (solid ellipses and linear regression lines) and N (dashed ellipses and linear regression lines) are plotted together in each panel. Nonparametric ellipses include 68% of points. Regression coefficients are shown with 95% CI expressed in units to avoid excessive trailing 0s. Significant regressions are bolded; italics denote that the 95% CI and mean value for N are outside that of IH; values are presented as IH vs. N, respectively. Fasting (left) and fed (right) regression of PTH on serum Ca/1 mmol/l is significant for IH but not N: −72 (−111, −31) vs. −9 (−63, 45) and −30 (−38, −22) vs. −2.6 (−17, 11.8), fasting and fed, respectively.

