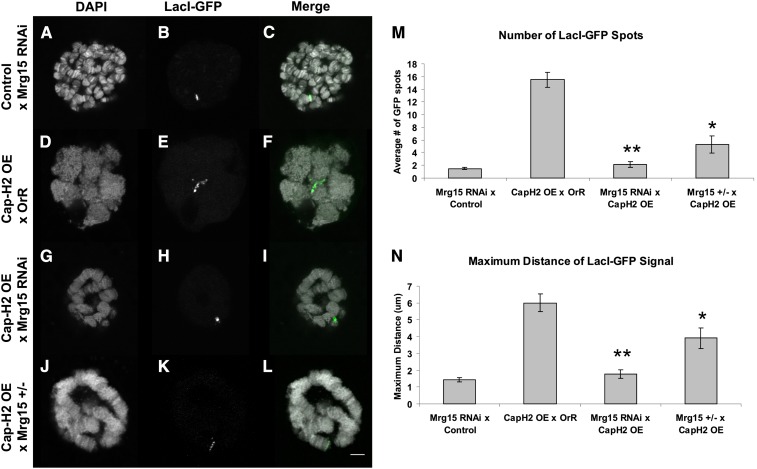
Figure 2.
Mrg15-RNAi suppresses Cap-H2 overexpression phenotypes in salivary glands. (A–C) Single salivary gland nucleus of a control UAS > Mrg15-RNAi/+, Hs > LacI-GFP/+, LacO (60F)/+; Hs > Gal4/+. (D–F) Cap-H2 overexpression (OE) line crossed to Oregon-R resulting in larvae as follows: Hs > LacI-GFP/+, LacO (60F)/+; Hs > Gal4/+, and UAS > Cap-H2EY09979/+. (G–I) Cap-H2 overexpression line crossed to a Mrg15-RNAi line resulting in larvae as follows: UAS > Mrg15-RNAi/+, Hs > LacI-GFP/+, LacO (60F)/+; Hs > Gal4/+, and UAS > Cap-H2EY09979/+. (J–L) Cap-H2 overexpression in an Mrg15j6A3 heterozygous background resulted in larvae as follows: Hs > LacI-GFP/+, LacO (60F)/+; Hs > Gal4/+, UAS > Cap-H2EY09979/+, and Mrg15j6A3/+. The left column (A, D, G, and J) is the DAPI channel. The middle column (B, E, H, and K) is the GFP channel. The right column (C, F, I, and L) is a merge of the two channels with DAPI in white and GFP in green. The white scale bar in L indicates 5 μm. (M) The average number of GFP spots per nucleus and standard error are plotted. One asterisk indicates a P-value of 1.9 × 10⁻⁴, and two asterisks indicate a P-value of 3.9 × 10⁻⁹ using a two-tailed, equal variance Student t-test. (N) The maximum distance between two GFP signals was calculated, and the average distance with standard error was plotted. Using the Student t-test, one asterisk indicates P = 0.02 and two asterisks indicate P = 1.1 × 10⁻⁶. For each genotype, n = 10 nuclei.

