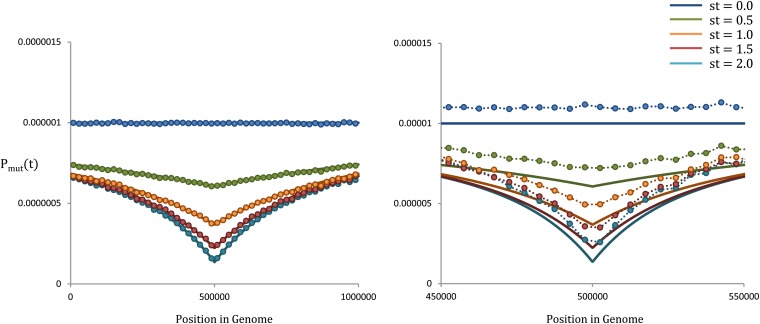
Figure 2.
The ancestral fitness distribution as a function of position. In both left and right, μ = 10−8, N = 104, and r = 4 × 10⁻⁸. The focal site is located at the center of a genome of length L = 106. Our theoretical results are shown as solid lines, while the simulations are represented with circles. On the left, s = 10−2, such that . On the right, s = 10−3, such that . We see that as Nes becomes smaller, the deterministic approximation begins to break down, and fluctuations in the population occasionally allow lineages carrying deleterious mutations to become a large fraction of the population. This, in turn, leads to less-fit ancestral lineages than predicted by our theoretical results.

