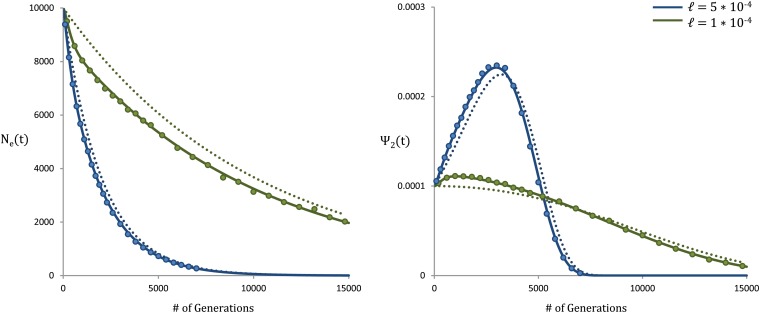
Figure 7.
Effective population size and coalescence times for an exponentially growing population. The blue curves represent an exponentially growing population with growth rate ℓ = 5 × 10⁻⁴. The green curves represent an exponentially growing population with growth rate ℓ = 1 × 10⁻⁴. The circles represent forward-time simulations, while solid lines represent our theoretical results from Equation 3 with N replaced by N(t) = Ne−ℓt. The dotted lines represent the predictions under a neutral model. The parameters are N = 104, s = 0.003, Ud = 0.0005, and R/Ud = 4.

