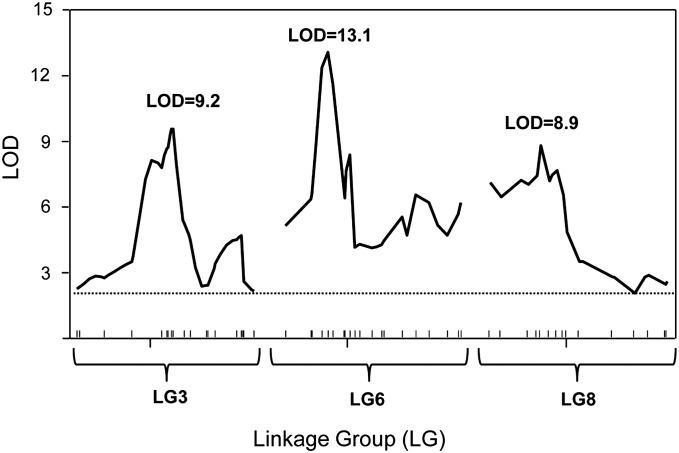
Figure 1.
Fine-mapping QTL-associated beetle susceptibility to tapeworm parasite in AIL (G15). LOD scores are presented on the y-axis and physical positions (in centimorgans) of the linkage group are given on the x-axis. LOD score values were determined using R/qtl software (Broman et al. 2003). The physical position of the markers was retrieved from the T. castaneum genome database at http://www.ncbi.nlm.nih.gov/genome/guide/beetle/index.html.

