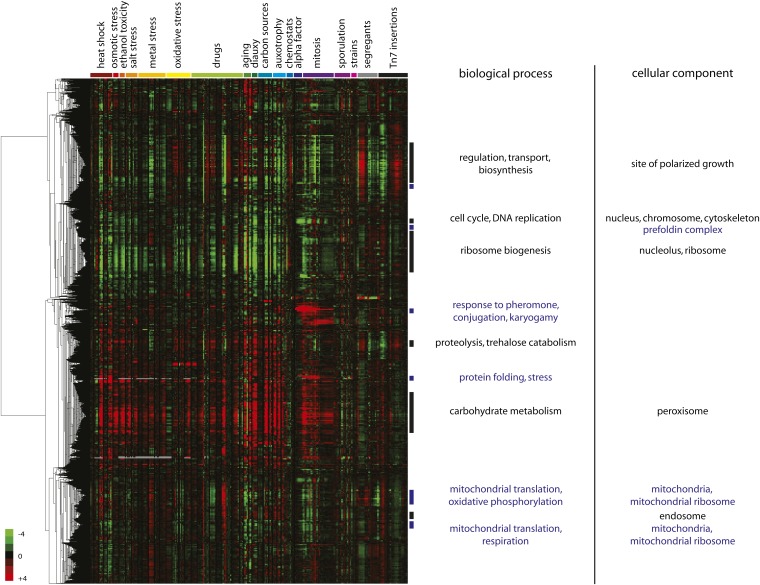
Figure 2.
S. bayanus gene-expression megacluster. Forty-six S. bayanus gene-expression data sets are shown as indicated by color-coded experiment labels with genes hierarchically clustered along the other dimension. Each data set was either zero transformed or mean centered to remove the reference. By assuming that all S. bayanus genes carry the annotations of their S. cerevisiae orthologs, statistically significant GO term enrichments for clusters of 25 or more genes with a correlation coefficient above 0.7 were determined using the program GOTermFinder, using a background distribution of only orthologous genes. These are indicated with vertical bars and labeled with related terms collapsed for simplicity. Data sets are ordered to group similar conditions. The data as plotted are available in Table S3.

