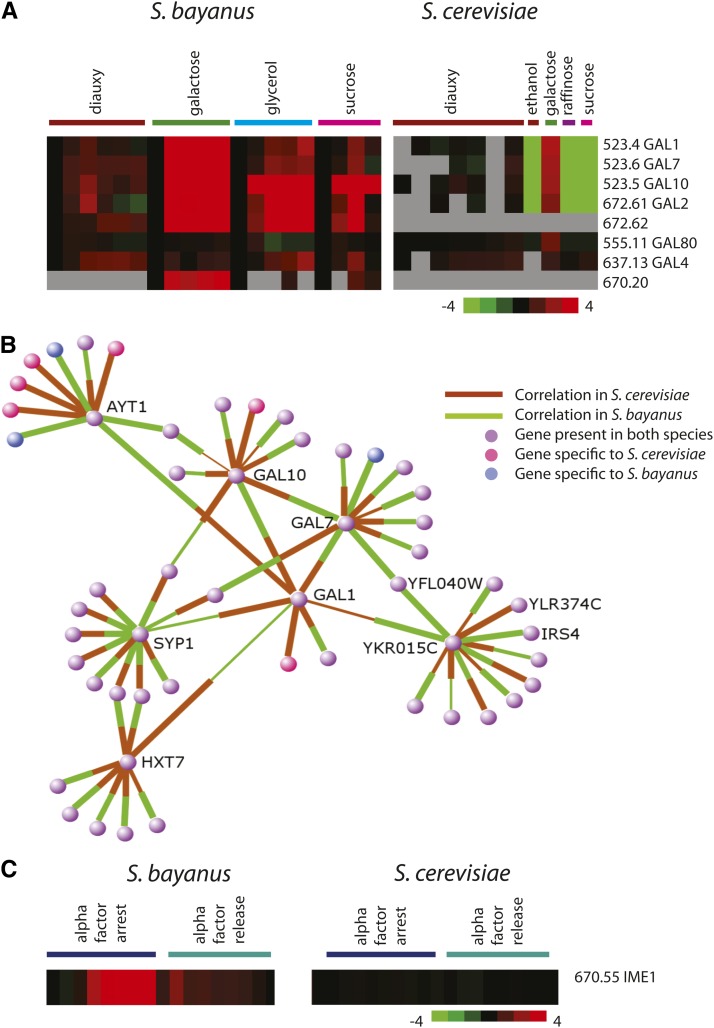
Figure 3.
Altered expression of genes in S. bayanus. (A) Galactose structural genes are induced by multiple carbon sources in S. bayanus but not in S. cerevisiae. S. cerevisiae carbon source data (Gasch et al. 2000) and diauxic shift data (Brauer et al. 2005) are as published. (B) A network view of gene-expression correlations with GAL1 comparing the pairwise expression correlation over all data in both species. The nodes indicate genes, and the thickness of lines indicates expression correlation. In cases where expression correlation is negative, no line is shown for that species, and the target gene is labeled. The node color indicates whether each gene is present in one species (pink or blue) or both (purple). An interactive network viewer for all genes is available at http://bayanusfunction.princeton.edu. (C) Expression of SbayIME1 and ScerIME1 are compared under conditions of alpha-factor arrest and alpha-factor release. S. cerevisiae alpha-factor arrest (Roberts et al. 2000) and release (Pramila et al. 2006) are as published.

