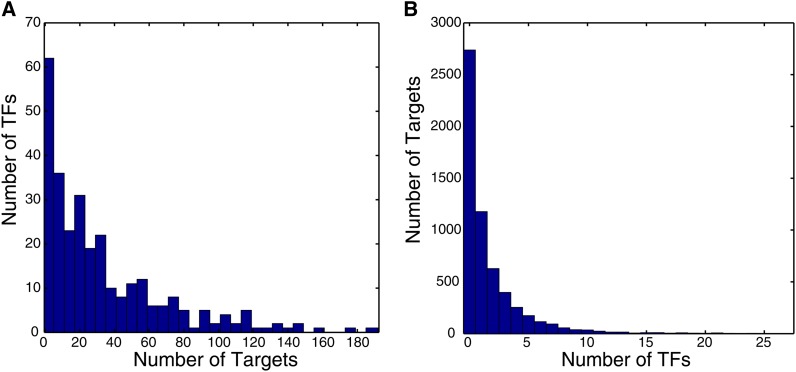
Figure 1.
Distribution of TF binding events. (A) Histogram showing the number of TFs that bind to specific numbers of targets (ChIP probes). If a TF was assayed in multiple conditions, each condition is counted separately. (B) Histogram showing the number of targets (ChIP probes) that are bound by specific numbers of TFs, counting each condition under which a TF was tested separately. Data were derived from Harbison et al. (2004), using a 0.001 P-value cutoff (Harbison et al. 2004).

