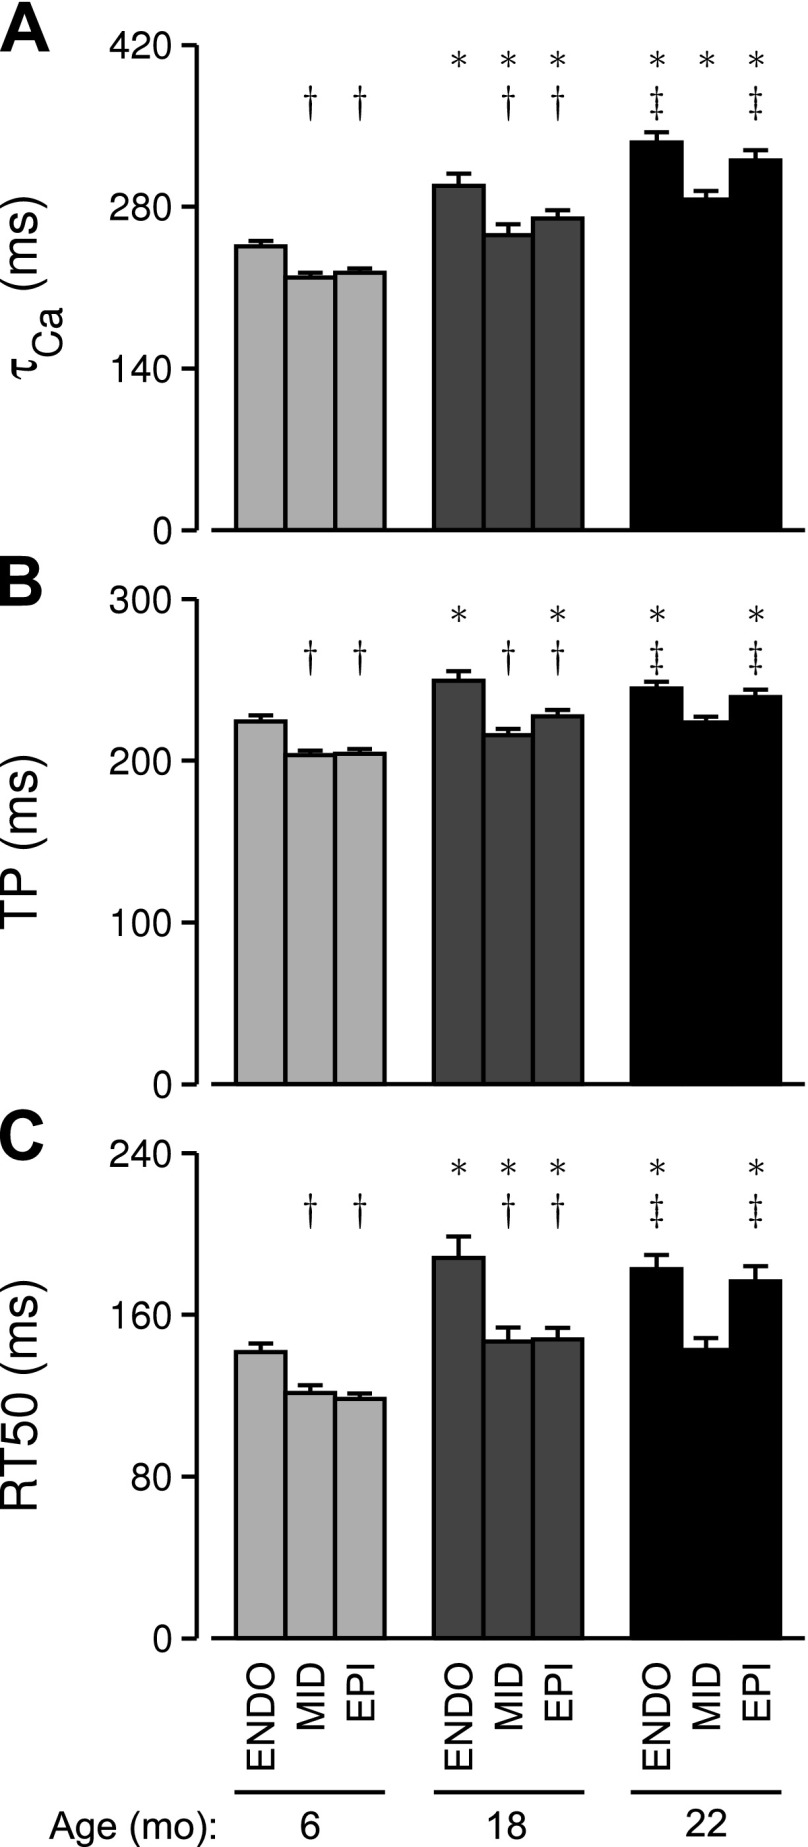
Fig. 3.
Transmural patterns of Ca2+ handling and contraction dynamics are altered with age. A: means ± SE of the time constant of F340/380 decay after peak (τCa) for each age-region group. B and C: same as A but showing unloaded sarcomere TP (B) and RT50 (C). *Significant difference vs. cells from the same region at 6 mo of age (P < 0.05). †Significant difference vs. endocardial cells at the same age (P < 0.05). ‡Significant difference vs. midmyocardial cells at the same age (P < 0.05).

