Fig. 6.
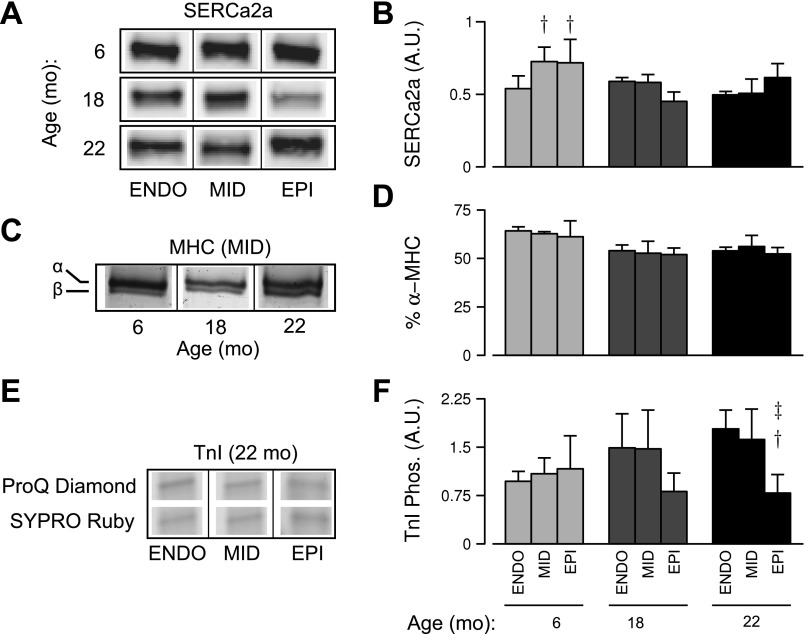
Biochemical analyses of tissue homogenates obtained from each age-region group (n = 3 animals per age group). Representative Western blot images (A) and summary data from densitometry (B) showing expression of SERCA2a (arbitrary units). Representative bands from midmyocardial samples of various ages showing separated α- and β-MHC isoforms (C) and the mean α-MHC isoform percentages across groups (D). E: representative TnI bands from gels stained for phosphoprotein (Pro-Q Diamond) and total protein content (Sypro Ruby). F: mean values of phosphoprotein-to-total protein ratios from densitometric analysis. †Significant difference vs. endocardial cells at the same age (P < 0.05). ‡Significant difference vs. midmyocardial cells at the same age (P < 0.05).

