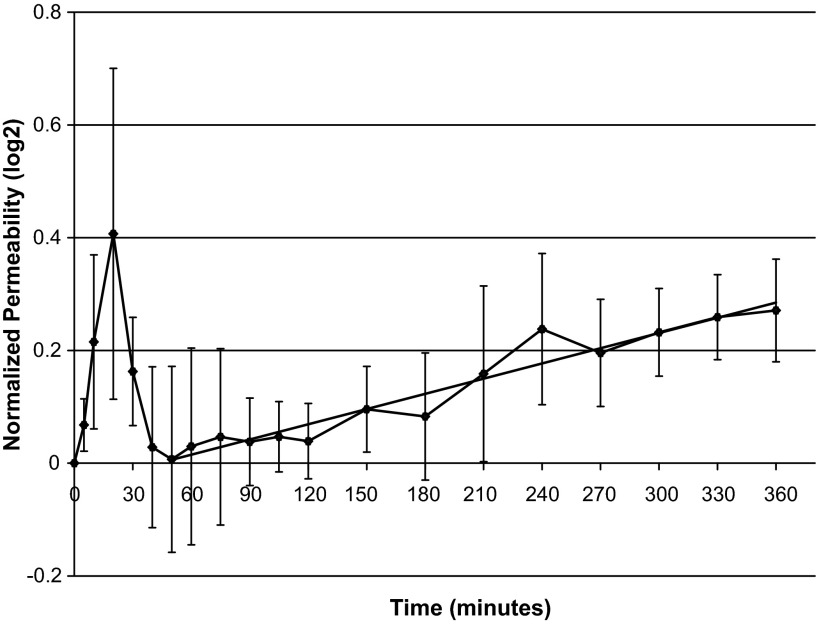
Fig. 1.
Normalized endothelial permeability during the adaptive response to the elevated shear frequency. Time 0, start of the frequency step-up. Endothelial permeability values were normalized to the preconditioning value. Error bars represent standard error of the mean, n = 4. A linear fit to the data from 50 to 360 min is shown (R2 = 0.94, P < 10−8).

