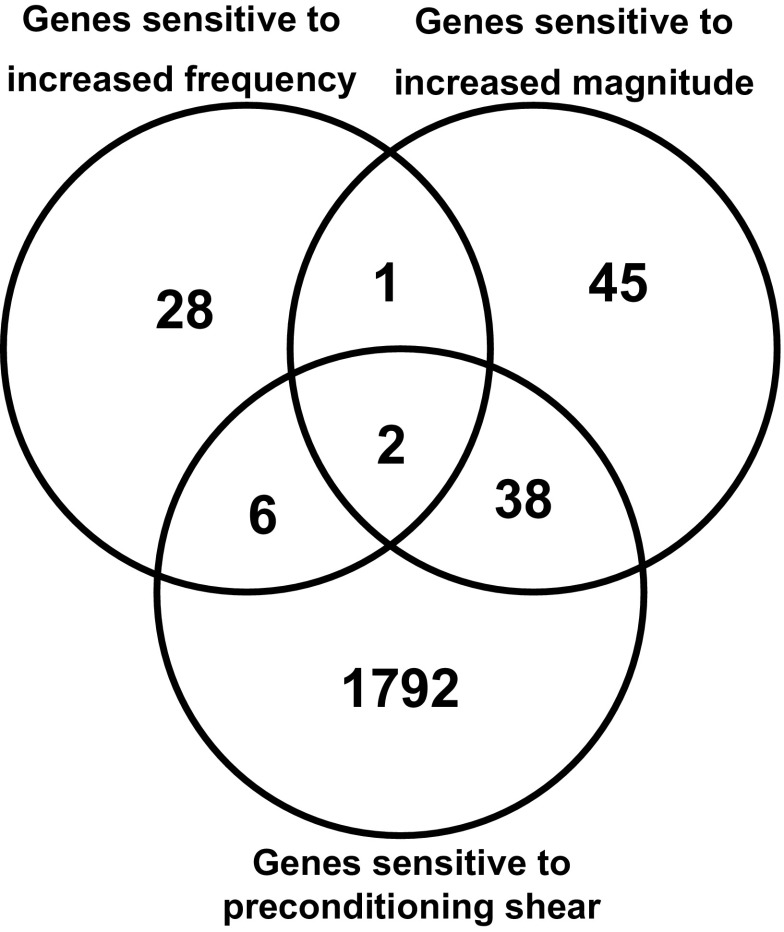
Fig. 3.
Venn diagram displaying the overlap of genes sensitive to the increase in shear frequency (current study), genes sensitive to the increase in shear magnitude, and genes sensitive to the preconditioning shear compared with static cultured cells (41). False discovery rate = 10%.

