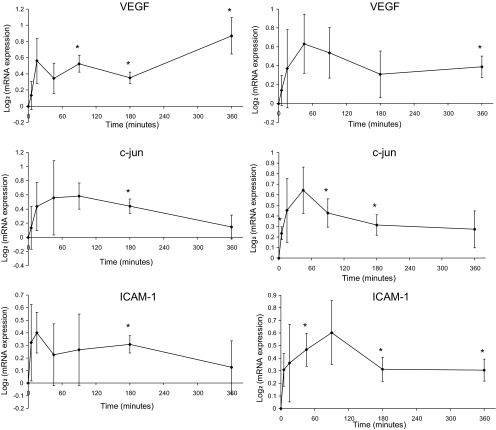
Fig. 5.
Temporal gene expression of VEGF, c-jun, and ICAM1 measured by microarray (left) and confirmed by RT-PCR (right); n = 4 for each time point. Expression values were normalized by the pre-step-up control levels. Error bars represent standard error of the mean. *P < 0.05, one-way t-test against zero.

