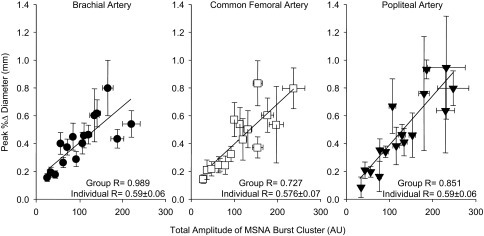
Fig. 5.

Correlations demonstrating relationships between the peak percent increase in conduit artery diameter and the total amplitude of the 16 MSNA burst clusters. The correlation derived from group means is displayed along with the mean for individual correlations. Values are means ± SE.
