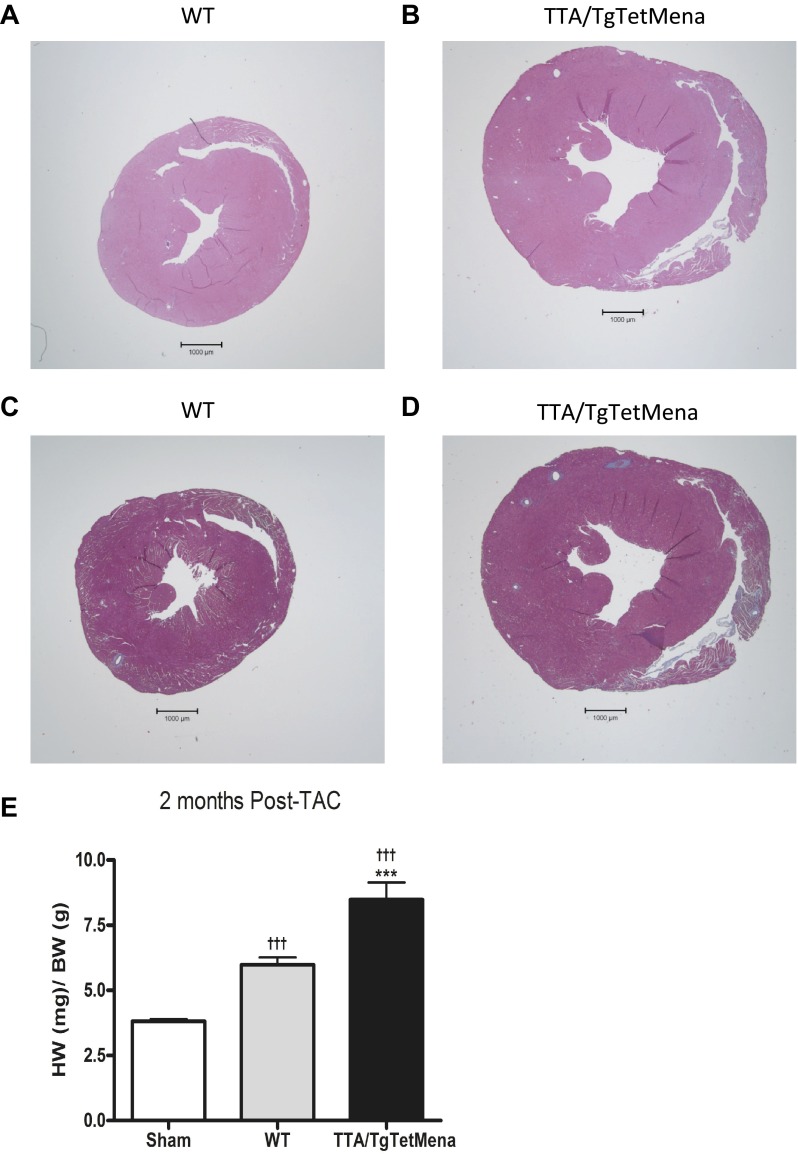
Fig. 6.
Cardiac Mena overexpression increases hypertrophy and fibrosis after TAC. A and B: representative hematoxylin and eosin stain images of WT (A) and TTA/TgTetMena (B) heart sections at 2 mo after TAC. C and D: representative Masson's trichrome stain images of WT (C) and TTA/TgTetMena (D) heart sections at 2 mo after TAC. Fibrotic tissue (collagen) appears in blue. Images were captured with a ×1.25 objective. E: cardiac hypertrophy was assessed by heart weight-to-body weight ratio in sham-operated, WT, and TTA/TgTetMena mice at 2 mo after TAC (†††P ≤ 0.001 vs. sham operated and ***P ≤ 0.001 vs. WT by 1-way ANOVA with Bonferroni posttest; n = minimum 5/group).

