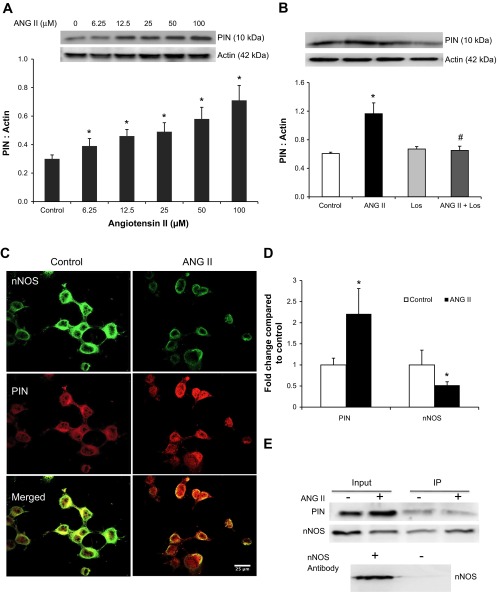
Fig. 3.
PIN expression with increasing doses of ANG II (A) and in control, ANG II (100 μM), losartan (Los, 1 μM), and ANG II + Los-treated NG108 cells (B). Top: a representative Western blot; bottom: densitometric analyses of PIN normalized to actin. Values are plotted as means ± SE from 4 independent experiments. Immunostaining of PIN (red) and nNOS (green) in control and ANG II-treated cells. C: representative pictures. D: cumulative data. Immunoprecipitation (IP) of PIN from control and ANG II-treated NG108 cell lysates (E). All gels are representative of 3–4 independent experiments. *P < 0.05 vs. Control, #P < 0.05 vs. ANG II.

