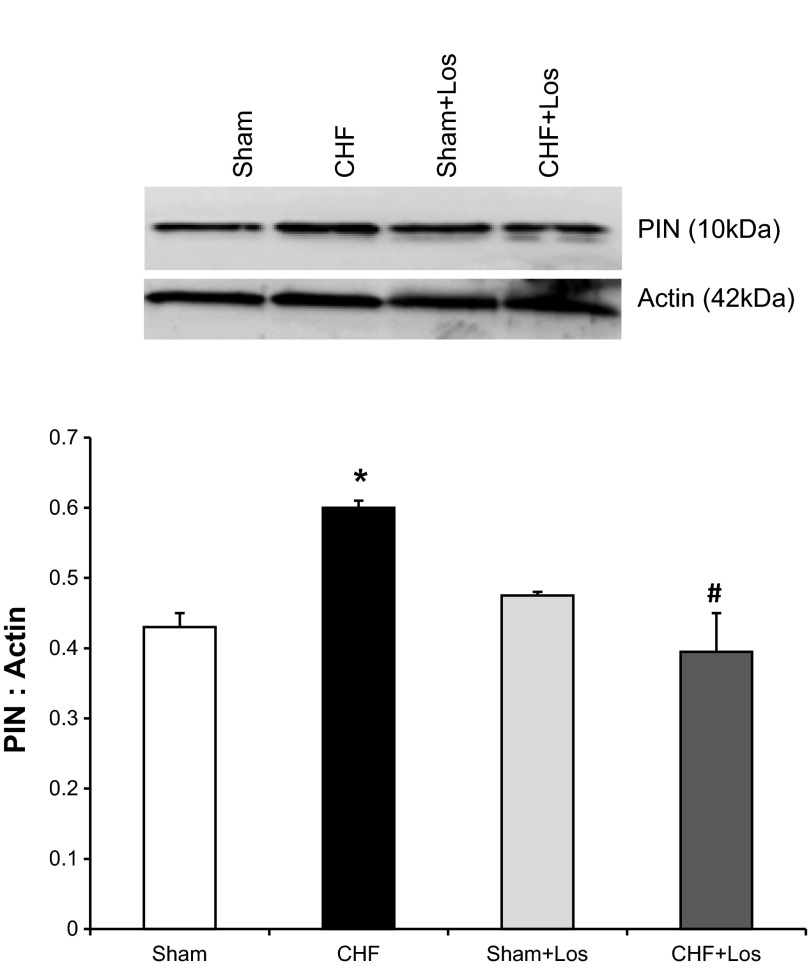
Fig. 4.
PIN expression in the PVN in four groups [Sham + Veh, CHF + vehicle (Veh), Sham + Los, CHF + Los] of rats. Top: a representative Western blot; bottom: densitometric analyses of PIN level normalized to actin. Values are means ± SE (n = 3–5 rats per group). *P < 0.05 vs. Sham, #P < 0.05 vs. CHF.

