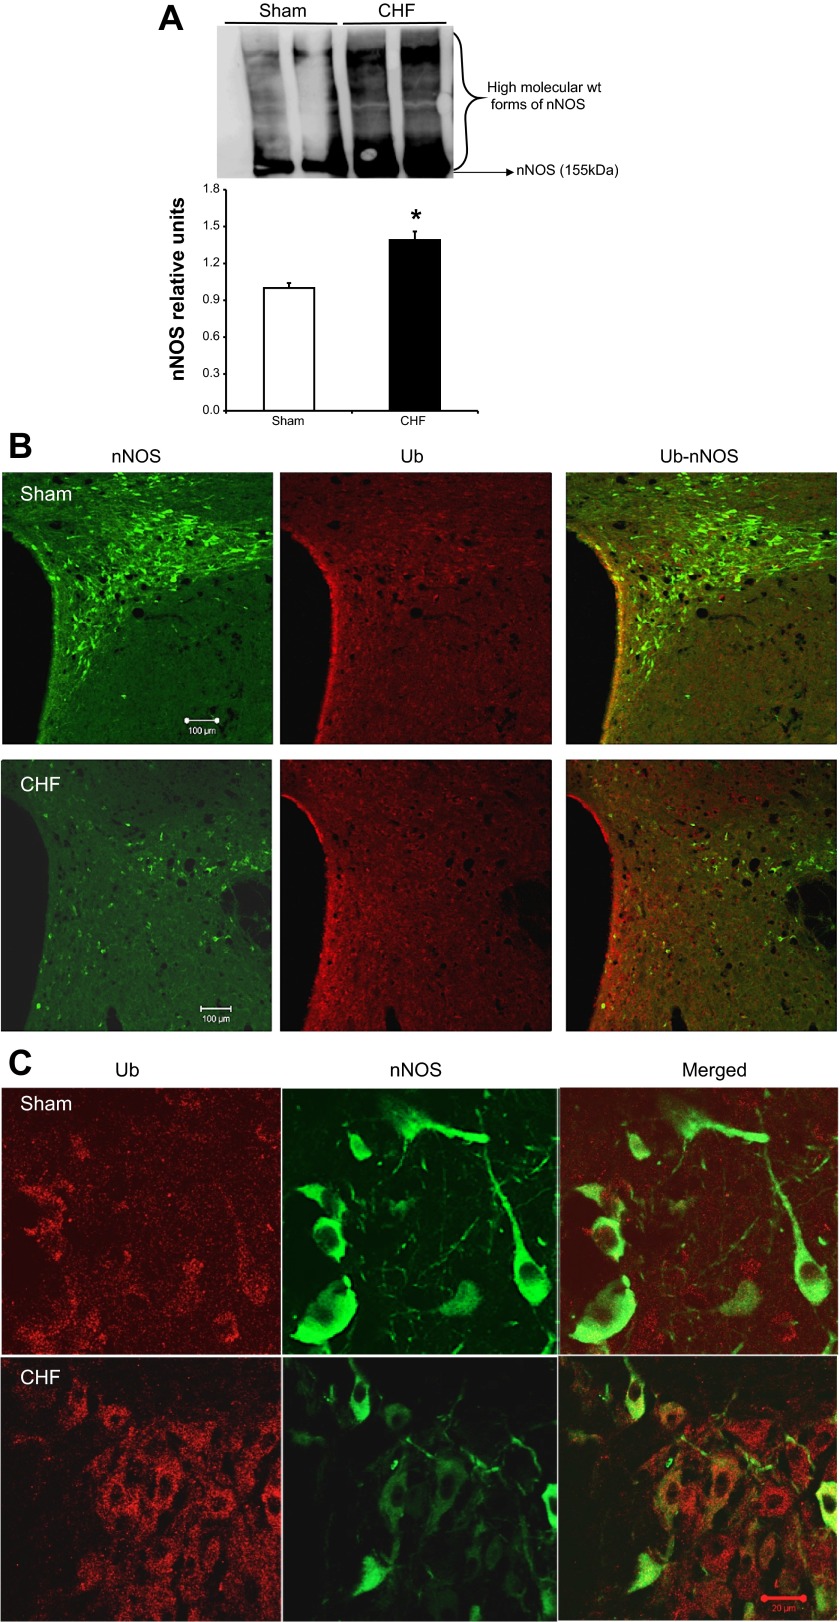
Fig. 5.
A: increased accumulation of high-molecular-weight forms of immunodetectable nNOS in the PVN of CHF rats. Top: a representative Western blot; bottom: densitometric analyses of ubiquitin (Ub)-nNOS bands. Values are means ± SE (n = 4–5 rats per group). *P < 0.05 vs. Sham. B: confocal photomicrographs of nNOS (green) and Ub (red) in the PVN of Sham and CHF rats. C: higher-magnification images showing Ub-nNOS colocalization in the PVN of CHF rats. Green, nNOS; red, Ub; orange, nNOS-Ub.

